
Newsletter blog
Children categories
Planning Debacle of IBM Site in West Pennant Hills
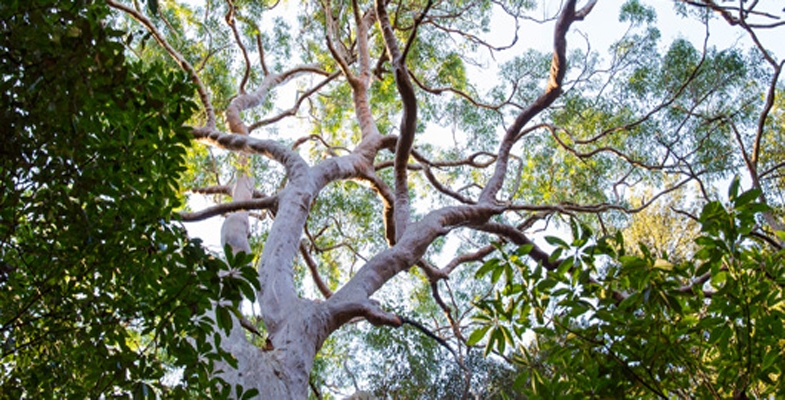
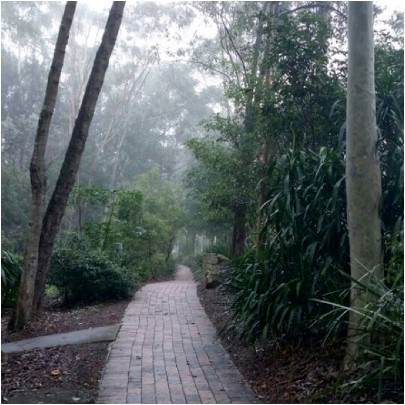 Back in the 1980s IBM built an office complex at 55 Coonara Road, West Pennant Hills. The building design won several architecture awards. The office environment is idyllic. The buildings are surrounded by an extensive tree canopy including Blue Gum High Forest that is now 25 to 30 years old. IBM worked with the National Trust to establish a bush regeneration plan and 40,000 native plants were planted.
IBM sold the land to property developer Mirvac in August 2010. The buildings were renovated in 2011 and IBM is still a tenant but Mirvac has set out to develop the site to take advantage of the site’s location near the Cherrybrook Metro development precinct.
The total site covers about 28 hectares. It is next to Cumberland State Forest. The IBM buildings are on the northern western part of the site. The southern part contains bushland that is at least 70 years old, some having not ever been cleared but may have been logged in the early days as happened in most of Sydney’s original forests. A large part of this area contains critically endangered Blue Gum High Forest or endangered Sydney Turpentine Ironbark Forest. The forest is Powerful Owl habitat plus there is known habitat for the threatened Dural land snail and two vulnerable microbat species. There hasn’t been a full ecological assessment of the whole site.
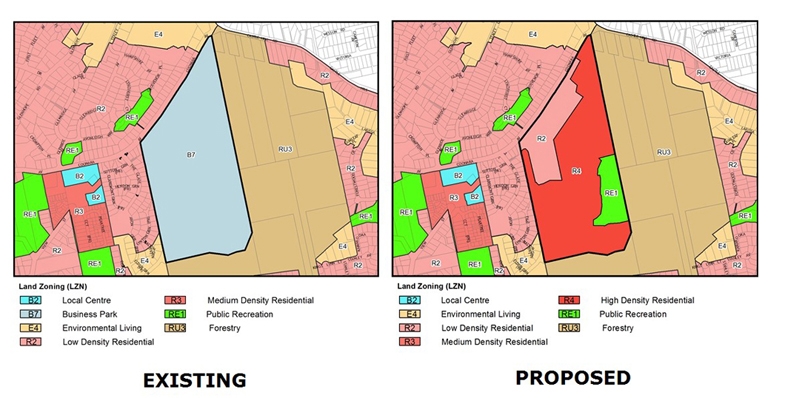
Mirvac originally proposed to build 1269 dwellings in the area of the old IBM buildings but negotiations with the Hills Shire Council cut this back to 600 dwellings. The whole site including the southern forest is currently zoned as B7, business park. The proposal was considered by council in July. They decided to submit the plan to the Department of Planning for a Gateway Determination of an amendment to the zoning of the site.
Council proposed that the redevelopment area be zoned as R2 medium density, an existing cleared area be RE1 but the remainder, the high quality bushland area, be zoned as R4 high density residential. Importantly, there was going to be no environmental protection for this area containing a significant area of critically endangered forest.
Once it became known all the local community groups formed a coalition called Forest in Danger to oppose the prospect of this magnificent bushland being covered in high rise apartments. In fact the immediate medium density development will also destroy high quality vegetation. There are several other reasons for rejecting the plans that are listed below.
The basic problem is that the reports from Mirvac and council focused on the development site. There was very little information on the rest of the site and therefore no consideration of fundamental issues with the potential loss of biodiversity.
Not only that, the Department of Planning provided a rezoning review briefing report on the site. It noted that A Plan for Growing Sydney does not identify this land for residential purposes and there is no alternative strategy endorsed by council regarding the site’s future use. So, on top of the issues with loss of the forest there is no justification for the rezoning consistent with a strategic plan for additional housing, employment, retail or other business development and transport infrastructure. Traffic on nearby Castle Hill Road is already severely congested. The claims of proximity to Cherrybrook Metro Station are questionable as the walk is more than the desirable criterion of 800 m from the northern part of the site but more like 2 km from the southern part up a steep hill.
The R4 zoning is proposed for the southern area even though no proper assessment has been made of bushfire management, stormwater and flood prone land on top of the loss of biodiversity. Once the zoning is changed the whole forest would be in danger of destruction.
Gateway Determination
Lots of letters of objection have been sent to the Department of Planning and the Hills Council. The Gateway Determination was made on 31 October. The Department of Planning advised council to give proper consideration to appropriate zoning including environmental zones.
One concern with the determination is the suggestion that there could be an area allocated as a forestry zone. The strange aspect of the determination is that the department is allowing council to conduct consultation with the community on an amended plan before the department has reviewed it. Surely the department should consider the new allocation of zoning in light of the overall strategy for north west development so the community has certainty.
Another community forum was held on 18 November in Cherrybrook. Over 250 people attended and heard a detailed description of the flawed process undertaken so far and of what would be lost if the current zoning were to go ahead. The rezoning plan is opposed by several new councillors on council including the mayor and nearby Hornsby Council.
Summary of Arguments against the Proposal
STEP is strongly opposed to any loss of Blue Gum High Forest (critically endangered) and Sydney Turpentine Ironbark Forest (endangered) no matter how small, as these tiny incremental losses will inevitably lead to their extinction in the long term. This applies to the potential loss in the medium density development area as well as the large areas of these forests in the southern forested areas where the R4 zoning is proposed.
Current Proposal for Medium Density Housing (First Part of the Development)
Asset Protection Zones
The proposed asset protection zone around the development area impacts 0.18 ha of Blue Gum High Forest up to 71 years old, and 0.5 ha of Blue Gum High Forest and Sydney Turpentine Ironbark Forest natural remnant bushland. The NSW Rural Fire Service discourages development in bush fire affected areas that would incur significant environmental costs. There are significant environmental constraints here which are not overcome in this proposal.
Impact of Internal Roads
Currently planned internal roads impact Blue Gum High Forest with a loss of 300 m2 proposed.
Powerful Owl
The impact on Powerful Owl residents would be substantial. These owls need not just peaceful nesting trees and roosting habitat but large areas of trees in which to hunt. Substantial numbers of trees 25 to 30 years old would be cleared for this development and hence reduce hunting opportunities and the probability of owl survival.
Fragmentation of the Forests
The Cumberland State Forest and 55 Coonara Avenue currently form an area of over 60 ha of bushland from the ridge, down to gully habitat. The development and asset protection zone reduce the area of trees and forests and the asset protection zone increases the separation of this site from the Cumberland State Forest. This fragmentation reduces the value of this comparatively large area of remaining Sydney Turpentine Ironbark Forest.
Recommendations
We recommend that the application is rejected in its entirety due to its impact on the environment, particularly Blue Gum High Forest, Sydney Turpentine Ironbark Forest and Powerful Owls. Any possible future development must not have any impact on these endangered communities species and Powerful Owls.
The bulk of this land should at the very least be rezoned to E2 for environmental conservation. Ideally the site should be added to the adjacent Cumberland State Forest and conserved in perpetuity.
More Information
For the latest information on the campaign against the development and more detail on issues with the proposal go to www.forestindanger.org.au.
Email or write to:
- Minister for Planning, Anthony Roberts This email address is being protected from spambots. You need JavaScript enabled to view it.
- Member for Bauklham Hills, David Elliot This email address is being protected from spambots. You need JavaScript enabled to view it.
- Director Sydney West Planning This email address is being protected from spambots. You need JavaScript enabled to view it.
- Hill Shire Council Mayor Michelle Byrne This email address is being protected from spambots. You need JavaScript enabled to view it.
Our National Parks Need Protection

Another round of ‘restructuring’ has hit our national parks staff. More managers and rangers with superb skills and experience have to reapply for the jobs they have been performing under extreme pressure from previous cutbacks. It is clear that the Department of Planning and Environment does not value ecological skills any more. Nobody knows what the selection criteria will be for the new positions – tourism experience perhaps?
A group of former NPWS employees has formed a group called Park Watch to monitor the impacts the cuts are having. There is a forum on 30 November at NSW Parliament House to discuss the future of national parks.
Carolyn Pettigrew, one of the members of Park Watch presented a talk on ABC Radio National’s program Ockham’s Razor. Here is a transcript reprinted with permission from Carolyn.
Introduction from Robyn Williams
Conservation. It's a word that sounds a bit like conservative, doesn't it? But the conventional wisdom these days is that environmental matters are green - green in philosophy and probably green in politics. But this didn't used to be the case. When I went to my first meeting of the Australian Conservation Foundation in the early 70s, the president was not Peter Garrett, who would have been about 20 at the time, but Prince Philip. And back then the president of the United States, Richard Nixon, he of tainted memory, was behind some of the most far-reaching environmental initiatives which in 2017 are steadily being dismantled by Donald Trump. So what about our own national parks, where did they come from, and why should we care.
Carolyn Pettigrew
2017 is the 50th anniversary of NSW National Parks and Wildlife Service. Born out of the Land Department's Parks and Reserves division and the NSW Fauna Protection Panel, it was largely the brain child of a Liberal politician, the Hon Tom Lewis.
The service's 50th birthday is a cause for celebration - as some of its achievements are really outstanding. The declaration of the Border Ranges and Blue Mountains National Parks as world heritage regions must be among the highlights, signifying the importance of these areas not only to Australia but the world.
National parks and reserves represent the highest level of protection available to our unique fauna and flora, and are vital to their survival. They are becoming even more important as threatening processes outside the reserve system put pressure on our remaining natural ecosystems. Unfortunately, the ability of our national parks and reserves to protect this natural heritage is being eroded - both within and outside the parks.
The National State of the Environment Report 2016 states that the threatening pressures on biodiversity include land clearing, invasive species, the fragmentation of habitat, changed fire regimes, and climate change.
Most of these exert a high or very high pressure on biodiversity, and are worsening. The cumulative and interacting effects of these pressures amplify the threat to biodiversity in Australia.
Excessive land clearing poses a particular threat.
It certainly surprised me to learn that Australia has a land clearing rate similar to Brazil and Indonesia. Queensland alone has cleared more than one million hectares of woodland in the past 10 years, and New South Wales looks set to follow suit.
In 2013 the NSW Government developed a program called Save our Species (SOS). This program provided the framework for identifying threatened species and what was needed to ensure the survival of threatened species for the next 100 years. It made sense of all the efforts being made by various environmental groups, communities, academic institutions, and the government to halt the loss of species. SOS identifies where the gaps are and ranks the importance of the work needed. Importantly, there is some funding available for groups to carry out the work required.
Backing the SOS plan was legislation designed to protect biodiversity and to halt the loss of habitat on land outside the reserve system. This system of protecting against land clearing wasn’t perfect - but it was crucial to making the SOS plan work.
Unfortunately, it was met with hostile opposition by powerful agri-business and political voices, so instead of modifying the rules the NSW government threw out the legislation.
What we're left with is legislation which is little more than a self-assessment process. If you read what a landholder can clear on their land it is virtually everything.
The loss of habitat that allowed some species to hang on and connect with nearby habitat will be devastating. The remnant koala population in northern NSW is a case in point - trees on private land and roadsides are being cleared at an alarming rate. These koalas seem destined to disappear.
Local citizen scientists, conservation groups like Birdlife Australia and the Australian Wildlife Conservancy and concerned landholders are all doing a magnificent job despite the odds but what are our governments doing?
Which brings me back to national parks and reserves. In NSW about 9% of the total land area is reserves of one kind or another. Not all threatened species depend on national parks and reserves but a hell of a lot most certainly do.
There are huge gaps in what we know about threatened species, their location, habitat requirements and distribution.
Very broadly, threatened species management in national parks and reserves fall into two categories – site-managed species like the Mallee Fowl and landscape managed species such as the threatened Powerful Owl. If I take the latter example, Powerful Owls are top predators. They feed mostly on arboreal mammals – possums of various kinds. That means they need tall forests with lots of hollow trees which also meet the requirements of other threatened species such as the yellow-bellied glider. So the land is managed at the landscape and ecological community level to cover as many species as possible.
Threatened plants and animals are identified in plans of management for a reserve. But there are a multitude of management objectives for each reserve. Making sense of the different priorities, the capital works and the human resource deployment needs professional park managers like graduate rangers and specialists.
You might think we have an army of these people but we don’t. Despite the fact that these are the folk who provide the intellectual grunt in reserve management their numbers are dwindling due to cut after cut. Every time you hear those words efficiency drive or restructure - think job losses. NSW has lost 30% of rangers over the past 10 years and more than 200 field officers, administration, specialist project and support staff.
Rangers and field officers are the men and women who do the hard lifting in our parks and reserves. They carry out fire-fighting, whale rescuing, walking track maintenance, weed control programs - to name just a few of their tasks. Loss of the expert knowledge of graduate rangers and specialists is tragic. These are the people who plan and implement the strategies that conserve representative ecosystems and the habitat of rapidly diminishing native Australian species.
There is even a move in NSW to classify all national parks staff as clerks, lower entry level qualifications and put in place hard progression barriers. Rangers and specialist jobs will no longer specify a degree as an essential job requirement. Of course, graduates could still apply for these jobs, but the career opportunities offered to them will be severely limited due to the hard promotional barriers.
But what has all this got to do with science? Two major impact pressures on threatened species in national parks and reserves are fire management and pest control.
Taking fire management as the example, the media and the public tend to regard the rural fire services as the ‘heroes’ which they definitely are. The problem is fire research and fire mitigation management is at least as important as fire-fighting, but it isn’t as sexy as lots of big red trucks. What is important to remember is that national parks and reserves have been created to conserve representative ecosystems, and fire regimes are biodiversity ‘drivers’ within most of our natural ecosystems. The importance of fire can be best illustrated by the fact that the absence of certain fire frequencies and intensities may be just as detrimental to biodiversity as a regime of fires that are too frequent or too intense.
Fire management, including fire mitigation must be based on good science, not political imperatives. Fire management must also encompass a complete appreciation of the other threatening processes and activities that mitigate against species survival such as habitat loss, soil erosion, water quality and carbon sequestration. That is why national park services throughout the country need a qualified, well-resourced and equipped ranger force to undertake assessment, management and implementation of fire management, soil conservation, weed management, visitor facilities, and development. It requires a holistic view, not simply a view of hazard reduction and asset protection.
We can't expect our parks and reserves to remain in a heathy state if jobs and knowledgeable people keep disappearing.
I believe the rot starts at the top. Increasingly we have ministers for the environment who wouldn’t know a wombat from a woylie. Maybe that’s not important but the same ministers don’t seem to have any regard for the moral responsibility they have as guardians of the natural national estate.
In the recent NSW by-election for the seat of Murray, the Nationals candidate was elected. His primary policy was to log Murray Valley National Park, and if that failed, instigate a land-tenure swap. There simply aren't many areas of river red gum forest left, so a tenure swap is a ridiculous suggestion. If that's not bad enough, the NSW timber industry and their lobbyists are running a campaign, Beyond Tenure, which is a thinly disguised attempt to allow logging in our national parks.
I believe that all of us, citizen scientists, conservation bodies, academics, concerned land holders - need to keep reminding politicians that we value our national parks and reserves. Our national parks and reserves are the genetic gene banks of our precious Australian flora and fauna and we shouldn’t lose them by political ignorance and neglect.
Extraordinary Loss of Trees in Hornsby
Hornsby Council weakened its Tree Preservation Order (TPO) in 2011 so that only tree species indigenous to the area (about 100 species) are protected apart from heritage conservation areas where all trees (as defined in the TPO) are protected. In June 2014 we wrote about a survey of tree cover that revealed that about 2% of the area was lost during 2011-13, about 27% more than the previous 2 years (see STEP Matters, Issue 176, p3). This data was recorded before the 10/50 bushfire clearing regulations came into force plus the tremendous number of new apartment approvals and infrastructure development.
Now the new mayor, Philip Ruddock has expressed shock at the latest data showing that 15,000 trees were cleared in the last year which equates to 60 hectares of canopy. The council has commissioned a report outlining options to strengthen tree protection measures to re-establish Hornsby’s tree canopy.
It is hard to get clear data of the tree cover in Hornsby because about two-thirds of the Shire’s tree cover is in national parks and reserves. Some reports do not make it clear whether they were looking a percentage loss of tree canopy in the total area or just urban areas.
In 2014, 202020 Vision (a collaboration of horticultural companies formed with the objective of making our urban areas 20% greener by 2020) published the Where Are All The Trees? report based on research undertaken by the Institute of Sustainable Futures at UTS Sydney. This was the first time that urban canopy had been benchmarked nationally.
This year, RMIT and Clean Air and Urban Landscapes Hub researchers published a follow-up report called, Where Should All the Trees Go? that compares canopy levels, overlays urban heat and socio-economic data, and provides an overall vulnerability indicator.
This report showed that Hornsby had lost 5% of urban tree canopy over the 5 years to 2016. And the latest report is that over 2016-17 the loss was 3%. At the current rate there will be very little urban tree cover left in 30 years’ time.
Loss in Pittwater (13%) and Warringah (7%) over the 5 years was even worse.
Dr Peter Davies pointed out in his talk at our AGM that there are many factors that will make it harder to increase urban tree cover in the future, the main one being the reduction in housing block sizes. The new block sizes of as little as 250 m2 leave no room for a backyard let alone trees. So the main responsibility for tree canopy will fall on local authorities.
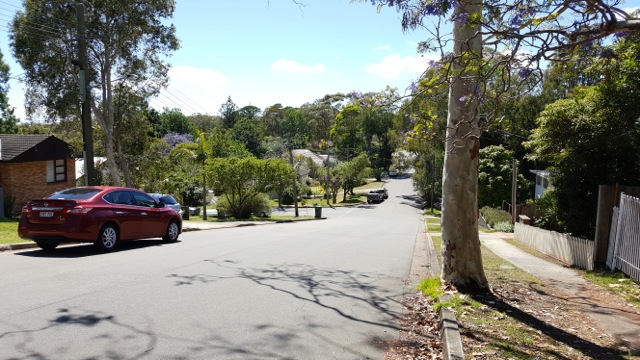
Looking down Harwood Avenue, Mt Ku-ring-gai. Before the change to the TPO in 2011 and the introduction of 10/50 in 2015 it was impossible to see the boundary of Ku-ring-gai Chase National Park. Now the suburban area is stark against the wall of trees in the national park.
Paper Maps are Good Friends
Robin Buchanan reminds us that maps on smart phones have limitations.
‘Just another lost bushwalker’ said the weary voice of the policeman at Hornsby Police Station when I rang to ask why there was a helicopter searching the bush below our house. For those who know the areas of Lane Cove, Berowra and Ku-ring-gai National Parks well it is hard to imagine becoming lost but it happens very regularly and even more so in larger national parks.
Too many people rely on smart phones. These are really useful but they have three disadvantages. They run out of batteries quickly if they are used for navigation for too long, they don’t show landform and they can’t give both a detailed view of where you are at the same time as giving a broad view of the area. Hand held GPS (global positioning system) units are better as they are more rugged; the batteries are only used for the GPS and are easily replaced. They also have designated maps installed but they still suffer the same problem as phones when you zoom in and out.
Paper maps never run out of batteries and you can simultaneously see where you are and where you are going – even if it is several kilometres away. These days I tend to take a phone, GPS and paper map with me at all times as experience has taught me that they all may come in useful. The following examples illustrate how useful maps can be.
We were on a track a friend had walked many years ago but as the sun slid down in the west the track became more and more overgrown and our speed became slower and slower. The GPS told us exactly where we were but the paper map was spread out so we could accurately gauge the distance if we went back, continued on or crossed the valley to a well-established tack. It quickly became clear that forward and backwards would see us out after dark but we should make it if we crossed the valley.
On another occasion a friend decided to walk ahead but missed the turnoff to the cars. No friend when we got there! The map was spread out and his most likely positions determined. The hunt was begun. He was quickly located at one of the points and all ended happily.
I have even given away a map when it was obvious that walkers had no idea of the size of the area in which they were walking: some simple calculations were done; if it has taken x amount of time to walk as far as you have, then to reach Berowra Creek and back is going to take four times as long. That will be after dark. Why not go to a nice lookout instead? Here, have a map.
Groups can gather around a map, make collective decisions, name far mountain ranges and reminisce about walks they have done before or plan the next walk. Good group dynamics.
1:25 000 Maps
The maps that give the largest view of an area are the 1:25 000 series (every distance on the ground is divided by 25 000). These are published by the NSW Government.
Bobbin Head Information Centre in Ku-ring-gai Chase usually have stock of the maps covering local national parks.
Don’t be put off by the name of the maps; they are titled by a main feature on the map. The Hornsby map is not a map of Hornsby, Hornsby is located in the centre of the map and lots of bushland is shown on the map as well. The local national parks are covered by several maps:
- Ku-ring-gai Chase: Hornsby, Cowan, Mona Vale and Broken Bay
- Berowra Valley: Hornsby and Cowan
- Lane Cove: Hornsby and Parramatta River
- Garigal: Hornsby,Parramatta River and Mona Vale
STEP and Friends of Berowra Valley
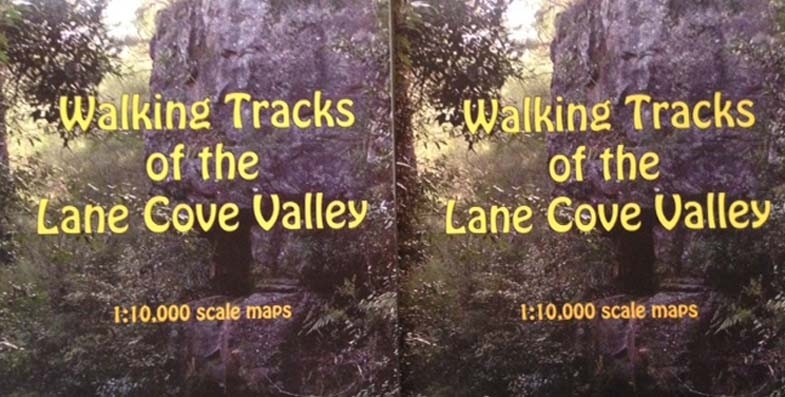
STEP’s three maps cover the Lane Cove Valley and Middle Harbour (North and South) and are printed at 1:10 000 (ground distances divided by only 10 000). They give a more detailed view of the area but are still broad enough to give you a good view of your surroundings.
The Walking Guide to Berowra Valley National Park published by the Friends of Berowra Valley is printed at a scale of approximately 1:18 000.
WildWalks
WildWalks produces detailed maps and descriptions of particular walks. You can download pdfs but printing them is safest. They are best used in conjunction with maps of the area such as the ones described above.
Great North Walk
The Great North Walk, through Lane Cove Valley and Berowra Valley is covered by The Great North Walk Companion.
Having Trouble Reading Maps?
If you have trouble reading paper maps and would like an introductory course, please let us know! Don’t be ‘just another lost bushwalker’.
New Steps on STEP Track
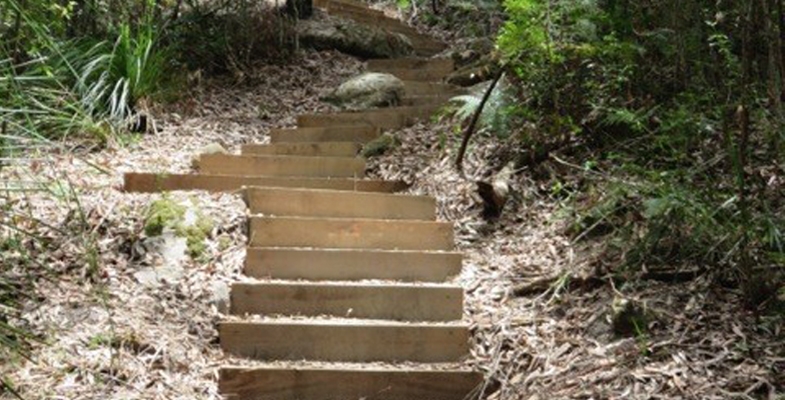
STEP applied for an Environmental Small Grant from Ku-ring-gai Council last year for further repairs to the STEP Track near the Lane Cove River. Previous repairs were carried out near Kingsford Avenue. The repairs have now been completed so the walk up or down the steep section is now much safer.
Annual Report for the Year to October 2017

The NSW Government forecasts of population growth for metropolitan Sydney over the next 20 years are frightening, at 37% or 1.7 million. Planning systems have been put in place and legislation has been enacted to facilitate development that claim to maintain a ‘liveable’ city but we have serious doubts this can be achieved given the attitude of the current government to the environment. Legislation like the biodiversity offsetting provisions that came into force in August are aimed a facilitating development, not protecting bushland.
STEP and all the community groups that are concerned about the impending loss of native vegetation and suburban trees will need to fight to try to keep Sydney’s unique bushland and wildlife.
This annual report gives a brief summary of our activities over the past year. More details are in the issues of our newsletter, STEP Matters and on our website.
Committee
Several of STEP’s committee members have knowledge of our environment that makes an essential contribution to our work in making submissions and liaising with local councils. They have been doing this voluntary work for many years. There comes a time when dedicated people need to give up these responsibilities.
Andrew Little has decided not to stand for the committee next year. During his period on the committee since 2005 he has provided detailed analysis of local soils, vegetation and bushland restoration issues that has formed the basis of our submissions. He also has detailed knowledge of planning laws and has led and organised our walks program. He will be hard to replace.
Our committee members are being stretched by the volume of developments and changes in legislation. We need more resources to continue our work. If you would like to volunteer or know a potential candidate please let us know. Help with a one-off issue or particular aspects of our work is very welcome.
Publications
The updated version of the Lane Cove Valley map was published late in 2016 and has been well received. The waterproof paper is proving to be much more resilient.
There continues to be steady demand for our maps that are appreciated by those who want to plan a walk by looking at the ‘big picture’ and identify options for different routes.
Sales of books has slowed over recent years in line with the general reduction in interest in larger format books. The Field Guide to the Lane Cove Valley remains the most comprehensive source of information about this beautiful part of Sydney. The Weather Book is useful for all people preparing to venture into the outdoors and simply a great source of information.
Accounts
Our operations broke even over the year so that membership fees and interest income cover our core activities. The use of email to distribute our newsletters has reduced costs significantly.
Total assets reduced due to accounting adjustments writing off the cost of our web system update and donations were made to some other environmental organisations with similar objectives to ours.
We appreciate the pro bono work done by Allan Donald, chartered accountant, who completed the audit of STEP’s financial statements.
Environment Protection Fund
We have maintained the Environment Protection Fund which provides deductible gift recipient status for donations that support STEP’s environmental objectives. We received a total of $349 in donations in the past financial year. The government is still threatening to impose more strict conditions on environment NGOs if they are to maintain entitlement to tax deductibility status of donations.
We have not made any payments out of the Environment Protection Fund for the past two years but we are currently developing a scheme for funding a student research project
Electronic Media
Our website has been working smoothly. Helen Wortham does a sterling job in keeping the website up-to-date and setting up the newsletter on the main page in an attractive and easy to use format so that individual stories can be selected or the whole newsletter can be downloaded.
Trish Lynch and John Burke continue to alert readers to current issues and events through Facebook and Twitter. Trish and John have established links with many like-minded people and organisations. Social media does receive a lot of bad publicity but careful use does facilitate valuable information sharing.
Education
We support the Young Scientist Awards run by the Science Teachers’ Association of NSW with a prize in the environmental sustainability category. The winner of the STEP prize this year investigated the design of nest boxes for sugar gliders.
We also supported the Children’s Threatened Species Art Competition. The primary school children produced some fabulous paintings.
Talks
We organised public talks over the past year on paleoclimatology, environment management in Hornsby, UNESCO World Heritage, the Hawkesbury River and the geology of Sydney Harbour.
Walks
Our walks program was disrupted by wet weather with two walks having to be postponed. Walks were held in the local area and on the Central Coast.
The walks aim to be educational and to encourage new walkers so most walks are not physically challenging. We thank Andrew Little and John Martyn for organising and leading walks this past year. If you have a request for a walk please let us know.
Newsletter
Our newsletter, STEP Matters, is our main means of communicating events, our activities and current issues. We also include other articles with an environmental angle that will be of interest to members. The newsletter is also sent to local councillors and politicians. We welcome alerts from our members of local events and developments and, of course, feedback on articles is always welcome.
Administration Matters
Attendees at the AGM will be asked to approve a major rewrite of our constitution so that it is consistent with the model rules developed by the Department of Fair Trading. We have taken the opportunity to amend our objectives. We continue to focus on conservation of bushland but the defined area of interest is expanded to cover northern Sydney rather than our local area. This reflects the fact that threats are sourced more from broader state issues rather than local government.
We thank Jan Newby for her help in creating the new draft.
Anniversaries
STEP was established in 1978 so 2018 is our 40th anniversary year. We are planning a celebration and publication of a historical report that is being prepared by Graeme Aplin.
It is 10 years since the Blue Gum High Forest Group, a local coalition of groups and individuals, including STEP, was successful in increasing the protection of a significant area of Blue Gum High Forest in St Ives. A number of walks and talks have been organised by FOKE during the year to celebrate this achievement.
Young Scientist Award 2017

STEP continues to sponsor an award for a project about an environmental issue under the Science Teachers’ Association Young Scientist Awards.
It was a difficult decision this year with some innovative and well thought out projects. The winner was Evette Khaziran, year 10, from Redeemer Baptist School, North Parramatta. Her project on the use of nest boxes by sugar gliders was the nearest to STEP's urban bushland focus and philosophy. Not only that, the work was well thought out and innovative with patient field observation and an outcome that could be applied to bushland areas all round metropolitan Sydney and beyond.
Threatened Species Children’s Art Competition

 This year, for the first time, STEP supported a great initiative organised by Forestmedia, an organisation that is aiming to increase community awareness of the plight of our threatened species and help to develop the next generation of environmental leaders.
Long-time STEP member and artist, Yvonne Langshaw, helped judge the winners which were announced on 7 September, Threatened Species Day, at NSW Parliament House.
The competition was very well organised and a great success. The fabulous entries were displayed in Surry Hills, the Botanic Gardens and Canberra.
Jake Ferguson won best written work for the summary below:
When I think of a Corrobboree I don't think of a frog. I think of dancing around on the land. But I guess that’s what a frog does. So I chose this frog because it’s native to our land and it has bright yellow Australian colours of our land. Australia's Southern Tablelands and waterways are very important to the life of this frog. Let’s look after them so the frog can keep dancing.

Lord Howe Island Rodent Eradication to go Ahead
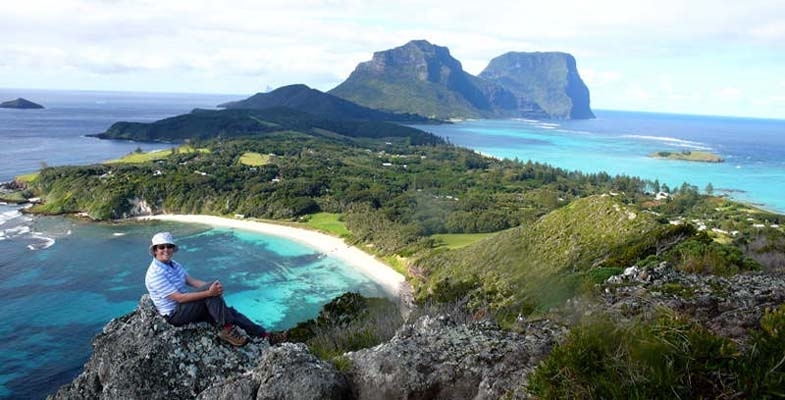
We recently wrote about the exhaustive research, economic analysis and consultation that has been undertaken into a plan to eradicate rats and mice from Lord Howe Island. At last it has been decided to go ahead.
The project will distribute rodenticide (brodifacoum) in cereal-based pellets via helicopter in the uninhabited parts of the island and via hand broadcast and bait stations in the settlement area in winter 2018 (June or July).
Eradicating invasive species from Australian islands has long been recognised as providing immense long-term benefits. It will be a complex operation that requires extensive cooperation but if successful will allow the island’s unique wildlife to flourish and make Lord Howe Island an even more exceptional place to visit.
It isn't Easy being Blue – Cost of Colour in Fairy Wrens

Male superb fairy-wrens change colour every year, from dull brown to bright blue. But being blue may be risky if you are a tiny bird that is easily spotted by predators.
This new study found that male fairy-wrens adjust their risk-taking behaviour after undergoing colour change, becoming more cautious while brightly coloured.
Colour and Risk
For many males, having beautiful colours is important for attracting choosy females. Researchers think attractive colours come with a cost, so that only the highest quality males can afford to display them. This may be helpful to females looking to select the best mate.
One possible cost of bright colours is increased predation risk, as bright animals are easily seen in their natural habitat. This cost can be dramatic (i.e. being eaten) but may more often involve changes in behaviour to mitigate risk, such as spending more time scanning for predators and being more responsive to perceived threats. Such behaviours are costly because they reduce the time available for foraging and are energetically expensive.
A relationship between bright colours, predation risk and cautious behaviour may seem intuitive; however this is difficult to test. This is because different coloured animals may also differ in their age, size, escape tactics and personality, which can influence both their behaviour and actual predation risk.
To address this, we tested whether individuals adjust their response to risk according to changes in their plumage colour.
Fairy-wren Antics
Superb fairy-wrens are small, charismatic songbirds. They live in groups with a dominant male and female and, often, several younger males.
These birds are vulnerable to predators such as kookaburras, butcherbirds, currawongs and goshawks. When a group member spots a predator, it gives an alarm call to warn the others. In response, other group members may race for cover, or ignore the alarm and continue about their business.
Male fairy-wrens change colour by replacing dull brown feathers with bright blue, black and indigo ones prior to breeding, turning brown again after the breeding season is complete. Individuals change colour at different times of the year, ranging from the Australian autumn (March to April) to late spring (October).

Although female fairy-wrens have a stable, social partner, when egg-laying time comes, they briefly leave their territory under the cover of darkness and “visit” the male who became blue earliest in the year. Many of the females in the surrounding area prefer the same male, who may father around 70% of the offspring in the neighbourhood. These attractive males are blue for longest (remaining blue for 10-12 months of the year) and so may face the greatest risk of predation.
Tracking fairy-wrens
We gave fairy-wrens different coloured leg bands, allowing us to follow the same individuals over time.

We compared the behaviour of the same males while they were brown and blue, as well as males that remained brown or blue throughout the study. This meant we could test for the effect of colour on responses to perceived risk while accounting for individual differences and possible seasonal changes in behaviour.
We estimated cautiousness in the birds by testing their response to alarm calls. This involved sneaking up on unsuspecting fairy-wrens in their natural habitat and broadcasting fairy-wren alarm calls from portable speakers.
We used two types of alarms: a low-danger alarm, which warns of a moderate threat, such as a predator that is far away, and a high-danger alarm, which signals an immediate threat.
Costs of being Blue
Responses to the low-danger alarm included fleeing for cover, an intermediate response (such as ducking or looking skywards) and no response, when the alarm was ignored. Fairy-wrens fled immediately after hearing the high-danger alarm, but differed in the time taken to return to the open.
We found that fairy-wrens were more cautious while blue; they fled more often after hearing low-danger alarms and took longer to emerge from hiding after fleeing in response to high-danger alarms. Blue fairy-wrens also spent more time scanning their surroundings and less time foraging compared to brown wrens.
This suggests that fairy-wrens perceive themselves to be at a higher risk of predation while bright blue and adjust their behaviour accordingly.

Blue Decoys?
Intriguingly, fairy-wrens also adjusted their behaviour according to the colour of other wrens in the group. When a blue male was nearby, wrens were less responsive to alarm calls and devoted less time to keeping a look-out.
Perhaps this is because fairy-wrens view blue group members as colourful decoys in the event of an attack. This could occur if predators are biased towards attacking the most conspicuous animal, which reduces the predation risk for surrounding individuals. Brown wrens could also be taking advantage of the greater time blue males spend scanning, allowing them to lower their guard.
Being blue for longest gives males the best chance of attracting females, but they need to be extra careful lest they get eaten before it comes to that.
![]() Coauthors on this research are Annalise Naimo, Niki Teunissen, Robert Magrath and Kaspar Delhey.
Coauthors on this research are Annalise Naimo, Niki Teunissen, Robert Magrath and Kaspar Delhey.
Alexandra McQueen, PhD Candidate in Behavioural Ecology, Monash University and Anne Peters, Associate Professor, Monash University
This article was originally published on The Conversation. Read the original article.
Finkel Review on the Electricity Market – What Happens Now?

The Chief Scientist, Dr Alan Finkel, was asked by the Council of Australian Governments (COAG) to undertake an independent review of the national electricity market (NEM) that:
- delivers on Australia’s emissions reduction commitments
- provides affordable electricity
- ensures a high level of security and reliability
This was complicated task that needed to take into account:
- the closure of ageing coal-fired power stations
- escalating extreme weather events (like heatwaves, bushfires and storms) driven by climate change that test the resilience of the system
- increasing gas prices
- rapidly declining costs of wind, solar and battery storage
It also had to be politically palatable for the federal and state governments.
The energy users, the general public and industry just want long-term policy certainty.
The major points made by the review and the Climate Council’s view are summarised below.
1. Emission Reductions
The minimum target for reducing emissions in the electricity sector should be a 28% emissions reduction below 2005 levels by 2030. While it places responsibility for more aspirational targets to 2030 and beyond with government(s), the review cautions higher targets could have ‘larger consequences for energy security’ and ‘implications should be re-examined’.
This target is consistent with the commitment made by Australia at the Paris Climate Change conference but the electricity sector needs to bear a greater share of the reduction. It is easier to reduce emissions in the electricity sector as many of the required technologies already exist and reductions in other sectors like transport and land use are harder to achieve. The Climate Change Authority, the government appointed advisory body, suggested that electricity emissions should reduce by two-thirds by 2030 and be zero by 2050.
2. Clean Energy Target
The Finkel Review proposes introducing a Clean Energy Target, which would effectively replace the current Renewable Energy Target from 2020. Gas and coal (with carbon capture and storage) would qualify under the Clean Energy Target, as well as renewable energy. The Clean Energy Target would set a certain target amount of new ‘clean’ electricity (expressed as GWh or % of electricity) based on the required emissions reductions for the electricity sector. The Finkel Review leaves the target baseline and emissions trajectory to 2030 and beyond for politicians to decide.
Technologies with lower emissions, like renewables, would receive higher benefits than those with higher emissions, like gas and coal (which would still be required to be below a set emissions intensity level to receive any benefit). New coal stations that do not meet the target can still be built without penalty, increasing the emissions reduction burden from ‘clean’ electricity.
The Clean Energy Council website explains this mechanism in more detail. Modelling undertaken for the Finkel Review (based on 28% emissions reduction for the electricity sector) indicates the Clean Energy Target mechanism (and an emissions intensity scheme) would result in lower costs to households and businesses compared with no action at all (business as usual). The modelling shows renewable power continuing to grow, up to 42% of electricity supply by 2030 (58% still comes from fossil fuels by then, with no further brown coal closures), in contrast to business as usual of 35% renewable electricity.
Power generated by renewable energy in 2030 under the proposed Clean Energy Target – at 42% – is far too low. Under the Clean Energy Target, electricity supply from large scale renewable energy would only increase 9% from 2020–30 (about the same increase as has occurred in the past ten years, a decade marked by significant climate and energy policy uncertainty).
3. Renewable Energy Reliability
The Finkel Review recommends a new requirement on new wind and solar power plants to provide a certain level of ‘dispatchable’ capacity (this was called a Generator Reliability Obligation). Dispatchable capacity is electricity that is available on call, as and when needed. New wind and solar would be required to provide a certain amount of battery storage or gas generation as determined by energy market bodies so that power is available with certainty, for example, when the wind isn’t blowing and other sources cannot provide sufficient power.
There was no equivalent requirement placed on new, or existing ageing gas or coal generation, despite the failure rate of ageing power stations increasing. For instance, in early February 2017, a severe heatwave across much of Australia’s south east and interior caused supply issues for the South Australian and NSW energy systems at a time of peak demand. In NSW around 3000 MW of coal and gas power capacity was not available when needed in the heatwave. High power users in industry were required to scale back production at great cost.
4. Future of Coal
The Finkel Review recommendations focus on incentives to encourage new lower emissions power plants to be built, rather than phasing out or penalising polluting coal and gas plants. So the approach is intended to bring on new renewables without incentivising the phase out of existing polluting coal generators. Coal generation would continue to provide over 50% of Australia’s electricity by 2030 and 24% by 2050.
Coal should be phased out much more quickly. Australia’s coal-fired power stations are old, and polluting by world standards. The Finkel Review acknowledges that by 2035:
… approximately 68% of the current coal generating plants will have reached 50 years of age.
Its modelling shows most still operating at 2030 and some even by 2050. The review even considers it a ‘benefit’ for these old, polluting coal plants to continue operating.
The key recommendation for coal-fired power is a new requirement for power plants to provide three years notice before closing. A schedule for the closure of aged plants should have been established years ago.
5. Future of Gas
The Finkel Review provides for a continuing role for gas power generation despites the issues with methane emissions and local environmental impacts of coal seam gas extraction. It acknowledges gas prices (and, as a result gas power prices) will continue to rise in future due to the demands of liquefied natural gas exports from Queensland, and the increasing price of producing gas from unconventional gas fields.
At current gas market conditions, it observes that battery storage may be more cost effective than gas in providing security and reliability in the near future. However, the Finkel Review paradoxically urges government and industry to prioritise gas exploration and development.
See STEP Matters Issue 190 for more details on the issues with gas powered electricity.
Government Response
The Turnbull government has supported all the recommendations except the Clean Energy Target. They can’t get away from the vested interests of the coal industry. There are even rumours that they would consider providing financial support for a new ‘clean’ coal-fired power plant.
Coal-fired power is on the way out, globally, and in Australia. Clean coal is very expensive, if not technically impossible. But using public funds to prop-up this 19th century technology would lock in climate-destroying pollution and higher power prices for decades to come.
The Turnbull government is out of step with state/territory and local governments. State and territory governments are already on track to deliver the Clean Energy Target on their own:
- Victoria, Queensland, Northern Territory and South Australia are set to generate 40–50% renewable energy by 2030
- Tasmania is already running off 90% renewable energy
- ACT has contracted enough renewable energy to meet all its electricity needs by 2020
The states are setting strong targets that will help Australia reach net zero emissions by (and ideally before) 2050 in order to protect Australians from worsening climate impacts.
South Australia is about to get a 150 MW solar thermal power plant that will meet 5% of the state’s power needs. The 150 MW plant near Port Augusta is expected to be operational by 2020 and will power all the South Australian government's electricity needs. The plant uses the sun as a source of heat that is reflected by mirrors onto a tower containing molten salt that is used to create steam that drives a turbine. It is expected that more of these plants will be built.
Several local governments including Ku-ring-gai, Willoughby and North Sydney, have signed up with the City Powers Partnership set up by the Climate Council. Local councils who join the partnership pledge to take five key actions across renewable energy, efficiency, transport and working together. The partnership acts as a support network for sharing expert information and establishing joint projects.
The information in this article is sourced from the Climate Council’s commentary called Unpacking the Finkel Review.
Protect Sydney’s Green Spaces

One of the major concerns about the NSW government’s biodiversity laws is the fundamental flaws in the Biodiversity Offsets Scheme, which will lead to the widespread clearing of remnant bushland in the Greater Sydney area, in return for developers' cash payments – see STEP Matters Issue 191. The application of these payments is unlikely to make up for the biodiversity that is lost. Several groups are so concerned that they have written a joint open letter to the premier. It is not only environment groups involved. Others are the Heart Foundation, the Institute of Landscape Architects and the National Trust.
The letter (see below) calls for action from the government to make the rhetoric a reality that the legislation will improve biodiversity within Sydney. Members of the general public are invited to sign the letter.
Dear Premier
With Sydney’s population projected to grow to 6.4 million by 2036 and the worsening climate change-related urban heat island effect, we write to urge you to ensure that adequate levels of green space are provided to all Sydney-siders and Sydney’s unique bushland and wildlife is protected.
Sydney-siders highly value access to a range of formal and informal green spaces – trees, bushland, parks and sporting fields. This is borne out in previous public surveys and the strong community reaction whenever public green space is sold-off or alienated for development.
Extensive research, both in Australia and overseas, clearly shows that the environmental, social, spiritual and economic benefits of green spaces are irrefutable. Green spaces cool our city, reduce energy costs, increase property values, promote healthy lifestyles, improve air and water quality, reduce net carbon emissions, prevent stormwater runoff and provide important wildlife habitat.
Sydney's green spaces also play a key role in the health of Sydney's iconic blue spaces. For example, the revitalisation and resilience of Greater Sydney's six major river systems – Hacking, Georges, Cooks, Parramatta, Nepean and Hawkesbury, as well as Botany Bay and Sydney Harbour depends on the health and connectivity of the surrounding vegetation.
Despite these benefits, current NSW government policy and legislation is failing to protect Sydney’s green spaces as these are actively being depleted by clearing and alienation for grey urban and industrial infrastructure development. The Total Environment Centre’s SOS Green Spaces map highlights over 70 green spaces currently at risk of destruction. This includes peri-urban areas undergoing rapid development and the impacts of major transport infrastructure projects such as the South East Light Rail and WestConnex. This deteriorating situation must be addressed as a matter of urgency.
A Plan for Growing Sydney Direction 3.2 aims 'to create a network of interlinked, multipurpose open and green spaces across Sydney' also known as the Green Grid. This concept is also supported by the work of the Greater Sydney Commission. However, specific actions, policies, legislative changes and funding are required to shift this concept from rhetoric to reality.
As key stakeholders representing a wide range of interests and expertise about urban green spaces, we urge you to:
- Assign responsibility for planning, implementing and monitoring Sydney’s green spaces to an independent body with the mandate, skills, funding and resources to achieve a comprehensive network of formal and informal green spaces designed to maximise benefits to Sydney-siders and protect Sydney's unique bushland and wildlife in the long-term.
- Prevent the clearing of bushland in the Greater Sydney area unless strict like-for-like offsets can be located and protected in perpetuity within the close vicinity of the bushland being cleared (note: under the government’s current draft Biodiversity Conservation Regulation 2017, the proposed Biodiversity Offsets Scheme will lead to widespread clearing of Sydney’s remnant bushland, including threatened species habitat, particularly in Western Sydney).
- Prevent the alienation of community and Crown land, as well as removal of the tree canopy, from Sydney’s green space network.
Sydney's green spaces are a vital component of its liveability and resilience as a city. Your positive action in protecting and enhancing our green spaces would strengthen your leadership in Australia’s much-loved and admired iconic first city, for current and future generations.
We, the sixteen signatories to this open letter look forward to an opportunity to discuss this important issue further with you.
Tax Deductibility Status of Donations to Environment Groups Under Threat

STEP’s public fund, the Environment Protection Fund, is registered as a Deductible Gift Recipient (DGR) via the Register of Environmental Organisations administered by the Department of Environment and Heritage. This means that donations to the fund can be claimed as a tax deduction.
We have received the annual return form. This form used to be a simple exercise especially for a small organisations like STEP. However this time there are more questions. The government wants to know the breakup of the application of donations in categories of on-ground environmental remediation (no definition provided), research, education, advocacy, legal, overseas, administration and staff. Is this question anticipating a change in the eligibility requirements for DGR status of donations?
In 2016 the Senate Standing Committee on the Environment conducted an enquiry on this issue. The committee’s report concluded that the purpose of granting DGR status should be to support practical environmental work in the community but then took a very narrow interpretation of the meaning of ‘practical’ and recommended that:
annual expenditure on environmental work be no less than 25% of the organisation’s annual expenditure from its public fund.
Treasury has released a Discussion Paper on this issue and the general administration processes for charities. Currently there is overlap and some confusion between reporting and responsibilities under the Charities and Not-for-profits Commission and the Register of Environmental Organisations. Resolving these issues is welcome but they are also proposing that eligibility should be based on the amount of remediation work carried out.
Why single out the environment organisations for what is basically a financial penalty compared with other charities and lobby groups?
The Discussion Paper states that:
DGR tax arrangements are intended to encourage philanthropy and provide support for the not-for-profit (NFP) sector. Along with other tax concessions to the NFP sector, DGR status encourages the delivery of goods and services that are of public benefit.
It asks for ‘stakeholder views’ on the recommendations of the parliamentary committee, and also whether the government should go even further:
Views are sought on requiring environmental organisations to commit no less than 25% of their annual expenditure from their public fund to environmental remediation, and whether a higher limit, such as 50%, should be considered?
We ask the question, is the revenue forgone in providing tax deductions to environment groups a cost or a benefit? It is more cost effective to prevent damage to the environment in the first place rather than clean up the mess afterwards.
Activities like research, education and monitoring are vital for the prevention of damage. Take as an example the recent ABC program on Four Corners of illegal dumping of construction waste next to the Hunter River discovered by the Community Environment Network on the Central Coast. They were doing the job for the Environment Protection Authority. How much would the clean-up cost if dumping continued unabated? This monitoring would not count as remediation.
Donations and their tax deductibility are especially valuable for organisations like the Environmental Defenders Offices that provide a vital means for the general public to receive advice of their rights when threatened by developments.
Often it is the people living near the development site or mine who are aware of the potential damage not the government bodies. Take the coal seam gas exploration operations as an example, local farmers had no way of obtaining the scientific analysis to be able to object to miners entering their land. Ultimately when the full picture of potential groundwater pollution became clearer the NSW government had to take steps to limit the powers of miners to explore.
Business lobby groups like the NSW Minerals Council are actively supporting the limitation on deductibility status on the grounds that groups like Lock the Gate are simply activists ‘destroying the economy’.
If the proposal goes ahead it will demonstrate that the financial clout and expert lobbying teams of business interests are more important than the views and wellbeing of individual citizens who are concerned about the environment or are adversely affected by a development.
Submissions are now closed but STEP found out about the paper in time to make a submission. It is not too late to send a protest to your local member of federal parliament.
How Should the Flood Risk from the Hawkesbury Nepean be Managed?
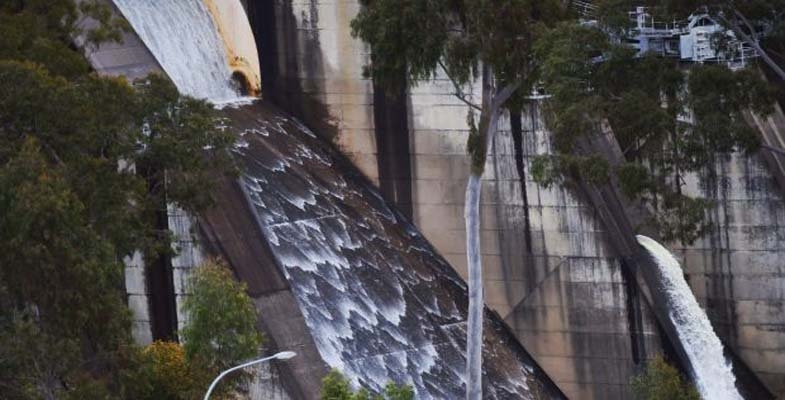
The NSW government thinks that raising the spillway wall of Warragamba Dam by 14 m will significantly reduce the risk of floods inundating homes in western Sydney. But experts have questioned whether the raising will achieve worthwhile benefits and whether the ecological damage can be acceptable. They argue the water levels in the dam storage should be better managed instead.
Brief History of Sydney’s Water Supply
The first water supply dams built to supply Sydney were the Upper Nepean dams (such as Avon and Cataract Dams) that still provide 20-40% of our supply. When this supply became inadequate the next step was the construction of Warragamba Dam that commenced in 1948 and was completed in 1960. The resulting storage in Lake Burragorang is one of the largest reservoirs for urban water supply in the world.
Following 1988 and 1989 high rainfall years, the NSW government re-evaluated the potential rainfall and flood risks and raised the dam wall by 5 m and constructed an auxiliary spillway on the east bank of the dam.
Back in February 2007 the Warragamba Dam water supply fell to its lowest recorded level of 32.5% after the prolonged drought from 1998. In response conservation measures and water usage restrictions were introduced. The desalination plant was built at Kurnell but this has hardly been used as we have had a period of above average rainfall ever since. Now the concern is flood risk. In 2012 and 2015 water had to be released to prevent a mass overflow. Currently the level is around 91%.
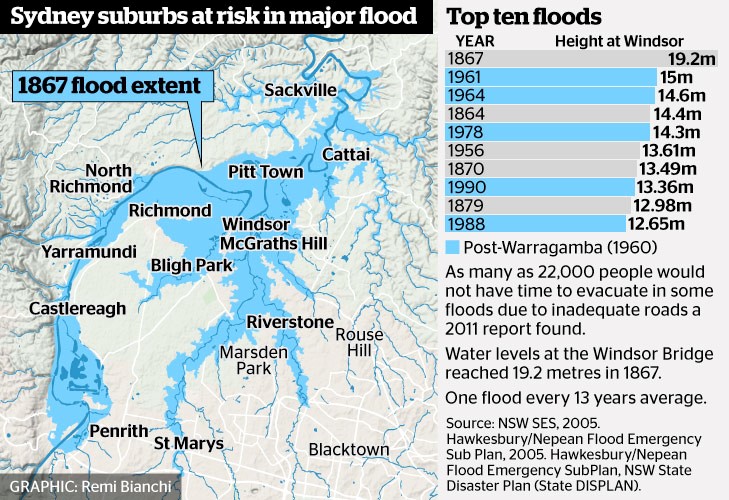 The benchmark for flood risk often used is the worst recorded flood that occurred in 1867 when the water height at Windsor Bridge was 19.2 m. This figure (from Sydney Morning Herald) provides data of past major floods and the flood extent in 1867.
According to the State Emergency Service, the estimated rainfall in 1867 in the lead up to the flood was 770 mm over three days averaged over the entire Nepean River catchment. The flood experience would be different now because several dams have been built in the Nepean catchment.
Government Proposals for Flood Mitigation
The high rainfall experienced in 2013 led to the need to release water causing minor flooding. The NSW government initiated another Hawkesbury Nepean Flood Management Review.
The review concluded that there is no simple solution or single infrastructure option that can address all of the flood risk in the Hawkesbury Nepean Valley floodplain. The risk will continue to increase with population growth. Evacuation is the only mitigation measure that can guarantee to reduce risk to life. According to the State Emergency Service a flood at the 1867 level would now lead to the evacuation of 90,000 people, damage to 12,000 homes and a cost of $5 billion.
As Prof Paul Boon explained during his STEP talk on 11 July on the Hawkesbury River, the topography of the river valley creates several challenges in understanding and managing flood risk.
The Hawkesbury has two main sources, the huge catchment of rivers that flow into Warragamba Dam that has its own flood plain from Emu Plains to Castlereagh. Then the Hawkesbury starts at Yarramundi when water sourced from the Grose Valley catchment in the Blue Mountains joins the Nepean. There is a flood plain around Richmond and Windsor through to Cattai but then more rivers join in and the valley narrows again with steep sandstone gorges and many twists and turns. This means that floods can bank up and spread out over broad areas of western Sydney.
Recommendations of the Review
Some points from the first review report are:
- Due to time constraints the review only assessed the flood mitigation potential of raising of the Warragamba Dam wall crest by 15 and 23 m. Pre-feasibility construction costs and reduction of flood levels have been calculated. However, economic, environmental and social costs and benefits have not been included at this stage. Detailed cost benefit analysis will be conducted for the options for the raising of Warragamba Dam in Stage 2 of the review.
- The review also assessed the potential for changing the operation of Warragamba Dam at its current configuration to provide for flood mitigation. Options examined different ways to create airspace to capture a portion of incoming floodwaters, by reducing the full supply level of the dam, ‘pre-releasing’ water if major flood inflow are expected based on forecast rainfall, or ‘surcharging’ the dam level during floods using the dam’s gates.
- The review concluded that only minor floods, below levels where significant damages occur, could be mitigated using the current dam unless its role as the main water supply to Sydney was compromised. It was also concluded that ‘pre-releasing’ of water from the dam prior to a flood was limited due to the inaccuracies in rainfall forecasts beyond three days, and the potential to increase or prolong downstream flooding.
- Reducing the full supply level of Warragamba Dam provides only a reduction in minor flooding and needs to be assessed against the impacts on Sydney’s water supply. The review considered lowering the full storage level by 2, 5 and 12 m, and concluded that the 2 m lowering had minimal flood mitigation benefits, and the
12 m lowering would have significant impacts on Sydney’s water supply. - Stage 2 of the review will further analyse surcharging the gates and reducing the full supply level for the mitigation of smaller floods, including the operational risks and the impact on Sydney’s water supply.
Even though Stage 2 of the review has not been completed, WaterNSW has been preparing environmental impact statements based on a proposal to raise the dam wall by 14 m and made a referral under the Federal Environment Protection and Biodiversity Conservation Act on specific matters of national environmental significance.
The intended operation after the spillway wall is raised is for water to be held back during a heavy rainfall event and then released slowly in the following weeks. This will provide additional time for evacuation and reduce the downstream flood peak. The stated intention is not to increase the current overall water storage level.
Environmental Impacts
 The Colong Foundation for Wilderness has expressed serious concerns about the impact of the current proposals. The fundamental points made in their Colong Bulletin (July 2017) are:
- Raising the dam level does not deal with the flood waters coming from the major rivers further downstream such as the Grose, Macdonald and Colo.
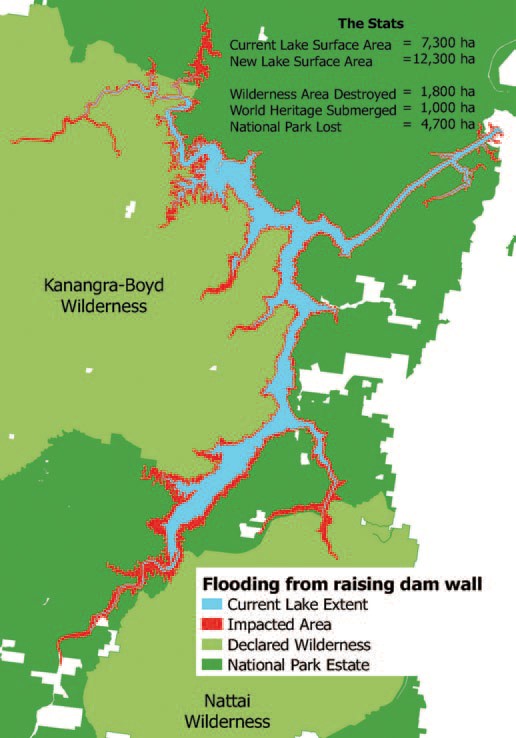
- The extra water storage is intended to be temporary but the vegetation around Lake Burragorang and its tributaries that will, nevertheless, be flooded for several weeks will die leaving ugly scaring of the banks. The upstream flooding will impact the Kedumba and Colong River valleys that are part of the World Heritage listed wilderness areas. A further 1800 hectares could be flooded and another 33 km of rivers inundated.
- The backed up water in the Kedumba River will be visible from Echo Point, the iconic lookout in the Blue Mountains at Katoomba. The figure illustrates the projected increase in areas affected by inundation.
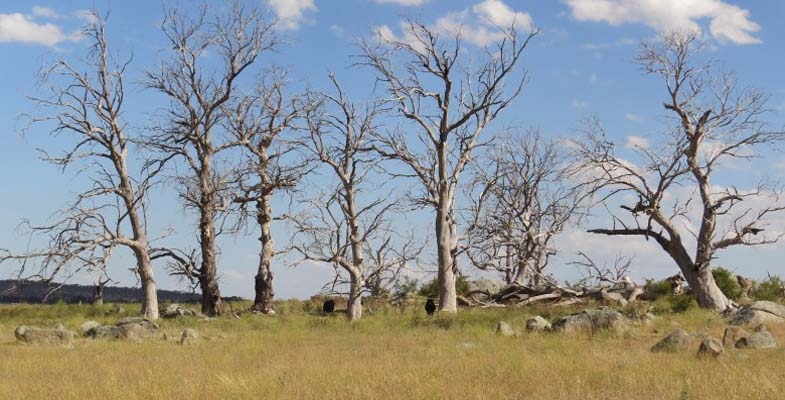
- Even flooding from a 1 in 50 year flood will extend 5 km into the Kedumba Valley and cause the death of 40% of the critically endangered Camden White Gum Forest. This species is listed as vulnerable under the Threatened Species Conservation Act. The Department of the Environment includes the forest in the Kedumba Valley as part of the Save Our Species biodiversity restoration program with an objective ‘to secure the species in the wild for 100 years and maintain its conservation status under the TSC Act’. Methinks WaterNSW should talk to the Department of the Environment.
- Aboriginal cultural heritage will be destroyed.
- Classic bushwalking areas will be lost, historic campsites drowned and access restricted. Bushwalkers are drawn to the pristine Kowmung River, a wild river that has inspired generations of walkers.
Can the Water Storage Level be Managed Instead?
Assoc Prof Stuart Khan, an expert in water engineering, disagrees with the need to raise the dam level. Management of the water level by controlled releases is a safer option so that the dam is never full. The desalination plant that can supply 15% of Sydney’s water needs, could be put to use when the need arises by way of earlier releases. Basically he disagrees with the review’s conclusions.
This is a fascinating risk management problem. Should we:
- reduce the water level if a period of heavy rainfall is projected and thereby reduce the water supply capacity with the backup of the desalination plant; or
- increase the dam wall at great expense and environmental damage that would threaten the tourism industry but still not eliminate the flood risk
Whatever option is taken flood risk cannot be eliminated. However the government is still going ahead with allowing massive population increase in the flood plains of the Hawkesbury Nepean system. As population grows the warning time needed to organise evacuation will increase.
Given the improvement in longer term weather forecasting. The government must explore options for smarter use of risk management techniques to adjust the storage levels. Raising the dam wall ignores this potential and could be a waste of $700 million.
Also future governments could easily be tempted to use the raised dam wall to increase water storage permanently to provide water supply for Sydney’s projected massive increase in population.
Other Serious Water Management Issues
As reported in the Sydney Morning Herald on 21 August, coal mining is impacting on the Sydney water supply catchments but the government is not carrying out adequate monitoring.
The 2016 Audit of the Sydney Drinking Water Catchment was tabled in parliament on the quiet. The National Parks Association discovered the report. It revealed that groundwater losses from longwall mining under the catchments in the Woronora areas has not been quantified. This is despite mining company reports have indicated that about 25 to 40 million litres a day have been entering the mines.
The 2013 audit report revealed that research was underway into the connectivity of surface and groundwater but no results have been revealed in the 2016 audit. This is not good enough given that these mining companies are still applying to expand their mining operations under the catchment.
There are also problems with coal mines leaking toxic chemicals into catchment rivers. Examples are the Springvale mine that has been pumping untreated waste into the Coxs River and the closed Berrima mine that has been leaking pollutants into the Wingecarribee River.
Fifty Years of the NPWS but is Anyone Celebrating?

In the early days of settlement in NSW development decision-making took little heed of its impact on the environment, the loss of flora and fauna and associated ecological communities.
In the 1970s, as human impact on our natural environment became more pervasive, a greater understanding developed of what was being lost and appreciation grew of our unique flora and fauna. Changes in attitudes led to the passing of legislation such as the Threatened Species Act, planning laws that include assessment of environmental impacts and the creation of the National Parks and Wildlife Service (NPWS).
The NPWS was established in 1967, 50 years ago, when the Fauna Protection Panel that was constituted under the Fauna Protection Act 1948 amalgamated with the Parks and Reserves Branch of the Department of Lands. The purpose of the act was to provide for the protection and preservation of fauna, while permitting the destruction and control of those species which were harmful to primary producers. The act applied to all fauna whether native or introduced.
The national park estate has been steadily increased over the years so that now 872 reserves and parks are under NPWS management. However the declaration of new national park areas has been reduced to a trickle in recent years. The area of the state represented is now about 9% of the total land area.
NSW has fallen well behind in achieving its international commitments to biodiversity protection. As a signatory to the International Convention on Biological Diversity, NSW has voluntarily committed to protect, by 2020, at least 17% of terrestrial and inland water, and 10% of coastal and marine areas. There is a lot of catching up to do.
It is hard to see these international commitments being met when the current government attitude is to treat the NPWS as a poor relation. There has been a steady reduction in funding since the Liberal National government came into power in 2011.
Staff numbers have been cut through regular redundancy programs so that vital long-term experience has been lost in areas like remote area bushfire fighting and vegetation restoration.
Staff have been subject to repeated structuring, the latest being a reduction in the number of regional managers from 14 to 8. Regional managers will now have impossibly large areas to manage.
Funding has been diverted to eye catching new projects rather than repairing degraded facilities and heritage sites.
In a frank internal memo in June last year, then deputy chief executive Michael Wright acknowledged that NPWS staff were facing:
… ongoing budgetary pressures associated with increasing costs and salaries, and decreasing expense allocations across future years … We need to be proactive in identifying and implementing opportunities for savings to be made and revenue to be increased, to ensure we can continue to implement our core conservation, emergency response and visitor services for the people of NSW.
The savings are being imposed despite the NSW being in a bumper financial position following asset sales and booming stamp duty income. And yet the Office of Environment and Heritage website describes national parks as a ‘bedrock of nature tourism’.
No wonder the government is making the 50 years anniversary a low key event! The situation is an embarrassment to a state with such magnificent natural areas that are a major drawcard for local and international visitors. The newspapers have been full of complaints about the deteriorating visitor facilities. The money is being spent on high profile development such as the mountain bike tracks in Garigal National Park and sports stadiums.
The current executive of the Office of Environment and Heritage has refused a proposal to update a 2006, 40th anniversary document, made available through a freedom of information request, to mark the 50th anniversary. The document, NSW NPWS Commemorative History 1967–2007 was withheld, effectively suppressed, by the then Department of Environment and Climate Change executives when the authors refused to make requested changes. It has remained in draft form under copyright ever since.
The treatment of national parks is consistent with other Baird/Berejiklian government decisions to reduce land clearing restrictions and threatened species protection and facilitate development with reduced standards for biodiversity offsetting. It seems care for the environment is not consistent with the politicians’ mantra of growth at any cost.
Royal National Park Threat
The latest insult is the suggestion by the powerful Roads and Maritime that 60 hectares of the Royal be acquired for an extension to the F6 freeway from Loftus to Waterfall.
The Royal is Australia’s first national park that was reserved for protection. It was formally proclaimed on 26 April 1879.
To make matters worse there has been a push to have the Royal National Park inscribed on the World Heritage list. This process has widespread support from conservationists and the local communities. In July a technical obstacle to including the Royal on the World Heritage List was removed by UNESCO’s World Heritage Committee when they added a listing criterion of ‘an area of importance in world protected area history’ (Mosley 2012). If the land excision for the F6 goes ahead there would be little chance that the listing could be accepted.
Mosley, JG (2012) The First National Park: A Natural for World Heritage, Sutherland Shire Environment Centre
Invitation to Participate in the Recent Climate-driven Ecological Change in Australia Project
Over the past century, average land surface temperatures have risen by almost 1°C across the Australian continent. Models suggest this may have already had significant impacts on Australia’s ecosystems and biodiversity, but these impacts have not been systematically investigated.
CSIRO Land and Water and the Department of the Environment and Energy are undertaking an exciting project to collect observations and anecdotes that will help to build a national picture of the kinds of ecological changes that have been occurring across the country over the past 10 to 20 years or more, and where changes may not have been occurring. We are looking for people with strong links to Australian environments (e.g. farmers, natural resource managers, ecologists, naturalists, rural scientists) to share their perceptions of recent ecological change (or lack of it) in an area they know well, and how this might link with climate or other change.
To participate, you would need to be able to select a natural area (e.g. your local region or farm, a nature reserve, urban bushland) that you have been familiar with for at least the last 10 years. Note that we are interested both in areas where change has been observed and where change has not been observed.
The survey will take about 30 min. Click here for additional information about the project.
Development Proposal Adjoining Cumberland State Forest
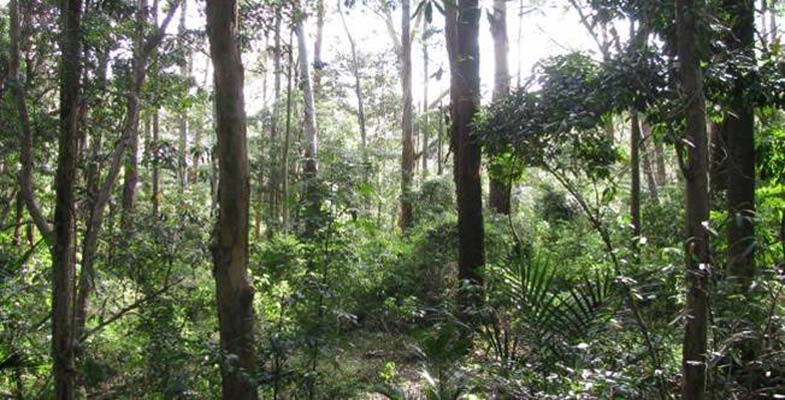
Please consider sending a submission opposing Mirvac's rezoning and development proposal for land adjoining Cumberland State Forest in West Pennant Hills to:
- Minister for the Environment, Gabrielle Upton This email address is being protected from spambots. You need JavaScript enabled to view it.
- Shadow Minister for Environment, Penny Sharpe This email address is being protected from spambots. You need JavaScript enabled to view it.
- Minister for Planning This email address is being protected from spambots. You need JavaScript enabled to view it.
- Hills Shire Council This email address is being protected from spambots. You need JavaScript enabled to view it.
- Member for Baulkham Hills This email address is being protected from spambots. You need JavaScript enabled to view it.
Background
The proposal is to rezone the majority of the 26 hectare site of heavily forested land to R4, high density residential. About 12 hectares on the southern side is of high ecological value containing critically endangered Blue Gum High Forest or endangered Sydney Turpentine Ironbark Forest. The rest of the site contains many mature trees believed to be over 30 years old.
The initial development plan is to allow for 400 apartments and 200 medium density houses in the northern part of the site with associated tree removal for bushfire protection. The proposed rezoning would allow eventual construction of apartment dwellings plus a recreational area on the entire site with no protective environmental zoning. This is a crucial example of the potential destruction under the NSW government’s new Biodiversity Offset laws.
The government is currently considering whether to give this rezoning proposal its in principle blessing under the Pre-Gateway review process and it is expected to be before the Hills Council before the end of the year.
Draft Submission Points
Thank you for the opportunity to make a submission on the proposed amendment to the Hills Local Environment Plan 2012 to facilitate medium to high density development at 55 Coonara Avenue, West Pennant Hills. This proposal is strongly opposed for the reasons outlined below.
- The proposed rezoning to R4 (high density residential) would apply to over 23 hectares that contains critically endangered Blue Gum High Forest and endangered Sydney Turpentine Ironbark Forest but no protective environmental zoning has been proposed. Any high density development would also destroy Powerful Owl habitats. This owl species is listed as a vulnerable species in NSW. An ecological assessment of the site discovered nesting trees and roosting habitats on, and adjacent to the proposed 28 hectare development.
- The initial development plan is to allow for 400 apartments and 200 medium density houses on the northern part of the site. Not only is the proposed development environmentally damaging – it also lacks appropriate infrastructure and amenities, with the nearest public transport link more than a kilometre away up a steep hill. Apart from losing treasured local bushland, neighbouring residents would also have to contend with additional traffic gridlock on local roads, especially Castle Hill Road, as a result of the increased local population.
- The bulk of this land should be rezoned as E2 for environmental conservation with strong protections for mature trees on any part of the site rezoned residential. We want this beautiful rare forest to be protected, not bulldozed for high-density apartments.
Special Resolution to Change STEP's Constitution

A special resolution will be moved at our AGM to modify our constitution.
In accordance with the constitution, official notice is hereby given of the proposed resolution.
Click here for a copy of the proposed constitution and a brief summary of the main changes.
Summary of Main Changes
The Department of Fair Trading has prepared a model constitution and we have used this to update our constitution. The main changes are that we have:
- updated the objects
- defined family and life membership as up to 2 members living at the same address
- stated that 4 constitute a quorum
- provided for a number of management processes and procedures to be carried out electronically, i.e. application for membership, register of members, signing of minutes, use of technology at committee members, making decision, electronic ballots, calling of special general meetings, use of technology at general meetings
If you have any questions, please send them to This email address is being protected from spambots. You need JavaScript enabled to view it. or call Helen on 9144 2703.
The Decoupling Delusion: Rethinking Growth and Sustainability
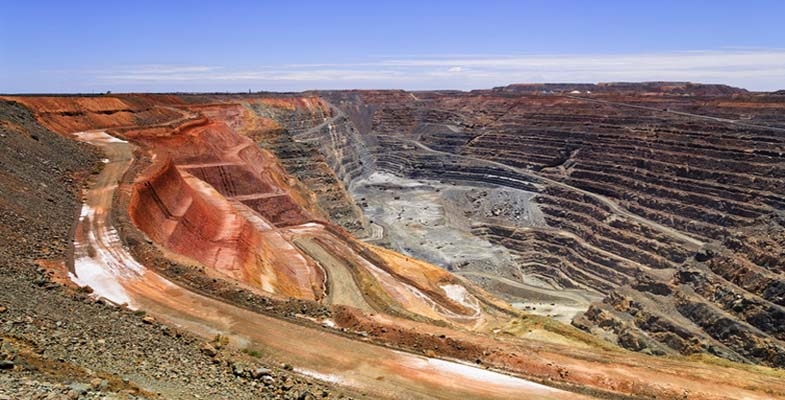
Our economy and society ultimately depend on natural resources: land, water, material (such as metals) and energy. But some scientists have recognised that there are hard limits to the amount of these resources we can use. It is our consumption of these resources that is behind environmental problems such as extinction, pollution and climate change.
Even supposedly 'green' technologies such as renewable energy require materials, land and solar exposure, and cannot grow indefinitely on this (or any) planet.
Most economic policy around the world is driven by the goal of maximising economic growth (or increase in gross domestic product – GDP). Economic growth usually means using more resources. So if we can’t keep using more and more resources, what does this mean for growth?
Most conventional economists and policymakers now endorse the idea that growth can be 'decoupled' from environmental impacts – that the economy can grow, without using more resources and exacerbating environmental problems.
Even the then US president, Barack Obama, in a recent piece in Science argued that the US economy could continue growing without increasing carbon emissions thanks to the rollout of renewable energy.
But there are many problems with this idea. In a recent conference of the Australia-New Zealand Society for Ecological Economics (ANZSEE), we looked at why decoupling may be a delusion.
The Decoupling Delusion
Given that there are hard limits to the amount of resources we can use, genuine decoupling would be the only thing that could allow GDP to grow indefinitely.
Drawing on evidence from the 600-page Economic Report to the President, Obama referred to trends during the course of his presidency showing that the economy grew by more than 10% despite a 9.5% fall in carbon dioxide emissions from the energy sector. In his words:
…this 'decoupling' of energy sector emissions and economic growth should put to rest the argument that combating climate change requires accepting lower growth or a lower standard of living.
Others have pointed out similar trends, including the International Energy Agency which last year – albeit on the basis of just two years of data – argued that global carbon emissions have decoupled from economic growth.
But we would argue that what people are observing (and labelling) as decoupling is only partly due to genuine efficiency gains. The rest is a combination of three illusory effects: substitution, financialisation and cost-shifting.
Substituting the Problem
Here’s an example of substitution of energy resources. In the past, the world evidently decoupled GDP growth from buildup of horse manure in city streets, by substituting other forms of transport for horses. We’ve also decoupled our economy from whale oil, by substituting it with fossil fuels. And we can substitute fossil fuels with renewable energy.
These changes result in 'partial' decoupling – that is, decoupling from specific environmental impacts (manure, whales, carbon emissions). But substituting carbon-intensive energy with cleaner, or even carbon-neutral, energy does not free our economies of their dependence on finite resources.
Let’s get something straight: Obama’s efforts to support clean energy are commendable. We can – and must – envisage a future powered by 100% renewable energy, which may help break the link between economic activity and climate change. This is especially important now that President Donald Trump threatens to undo even some of these partial successes.
But if you think we have limitless solar energy to fuel limitless clean, green growth, think again. For GDP to keep growing we would need ever-increasing numbers of wind turbines, solar farms, geothermal wells, bioenergy plantations and so on – all requiring ever-increasing amounts of material and land.
Nor is efficiency (getting more economic activity out of each unit of energy and materials) the answer to endless growth. As some of us pointed out in a recent paper, efficiency gains could prolong economic growth and may even look like decoupling (for a while), but we will inevitably reach limits.
Moving Money
The economy can also appear to grow without using more resources, through growth in financial activities such as currency trading, credit default swaps and mortgage-backed securities. Such activities don’t consume much in the way of resources, but make up an increasing fraction of GDP.
So if GDP is growing, but this growth is increasingly driven by a ballooning finance sector, that would give the appearance of decoupling.
Meanwhile most people aren’t actually getting any more bang for their buck, as most of the wealth remains in the hands of the few. It’s ephemeral growth at best: ready to burst at the next crisis.
Shifting the Cost onto Poorer Nations
The third way to create the illusion of decoupling is to move resource-intensive modes of production away from the point of consumption. For instance, many goods consumed in Western nations are made in developing nations.
Consuming those goods boosts GDP in the consuming country, but the environmental impact takes place elsewhere (often in a developing economy where it may not even be measured).
In their 2012 paper, Thomas Wiedmann and co-authors comprehensively analysed domestic and imported materials for 186 countries. They showed that rich nations have appeared to decouple their GDP from domestic raw material consumption, but as soon as imported materials are included they observe 'no improvements in resource productivity at all'. None at all.
From Treating Symptoms to Finding a Cure
One reason why decoupling GDP and its growth from environmental degradation may be harder than conventionally thought is that this development model (growth of GDP) associates value with systematic exploitation of natural systems and also society. As an example, felling and selling old-growth forests increases GDP far more than protecting or replanting them.
Defensive consumption – that is, buying goods and services (such as bottled water, security fences, or private insurance) to protect oneself against environmental degradation and social conflict – is also a crucial contributor to GDP.
Rather than fighting and exploiting the environment, we need to recognise alternative measures of progress. In reality, there is no conflict between human progress and environmental sustainability; well-being is directly and positively connected with a healthy environment.
Many other factors that are not captured by GDP affect well-being. These include the distribution of wealth and income, the health of the global and regional ecosystems (including the climate), the quality of trust and social interactions at multiple scales, the value of parenting, household work and volunteer work. We therefore need to measure human progress by indicators other than just GDP and its growth rate.
![]() The decoupling delusion simply props up GDP growth as an outdated measure of well-being. Instead, we need to recouple the goals of human progress and a healthy environment for a sustainable future.
The decoupling delusion simply props up GDP growth as an outdated measure of well-being. Instead, we need to recouple the goals of human progress and a healthy environment for a sustainable future.
James Ward, Lecturer in Water & Environmental Engineering, University of South Australia; Keri Chiveralls, Discipine Leader Permaculture Design and Sustainability, CQUniversity Australia; Lorenzo Fioramonti, Full Professor of Political Economy, University of Pretoria; Paul Sutton, Professor Department of Geography and the Environment, University of Denver, and Robert Costanza, Professor and Chair in Public Policy at Crawford School of Public Policy, Australian National University
This article was originally published on The Conversation. Read the original article.
Ku-ring-gai’s BioBanking Policy
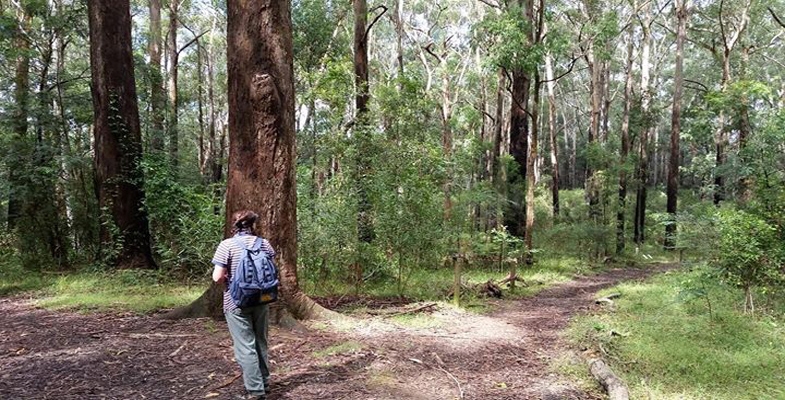
Ku-ring-gai Council is anticipating that there will be a strong demand for biodiversity offsets once biodiversity legislation comes into operation in August. At the council meeting on 13 June a decision will be made whether to support the adoption of the Biodiversity Banking and Offsets Scheme (BioBanking) as an ongoing biodiversity management approach within council owned or managed land classified as Community Land under the Local Government Act 1993. Public consultation to assess the community’s acceptance of the ongoing creation of BioBanking sites will take place before the scheme is finalised.
So far there is one BioBanking site at Rofe Park, Sheldon Forest and Comenarra Creek Reserve and a decision has been made for another site yet to be determined in respect of land clearing by the North Connex project. Ongoing BioBanking within council-owned or managed land will strengthen the protection of biodiversity values and increase the funds available for management activities which improve biodiversity conservation.
As pointed out in the council meeting papers and in the article about offsetting on changes under the Biodiversity Conservation Act 2016, the impacts of development within Ku-ring-gai could be offset elsewhere in NSW. This could be circumvented if offset lands are made available.
Also the new system is weaker in its requirements for like-for-like offset requirements. Plant Community Types (PCTs) which don’t exist within Ku-ring-gai could in some circumstances be offset with different PCTs occurring within Ku-ring-gai, creating further offsetting opportunities.
The selection of potential BioBanking sites in Ku-ring-gai will seek:
- to maximise landscape connectivity;
- to protect sites of high ecological value and resilience, as directed by council’s 2015–17 bushland prioritisation matrix; and
- to align with regional conservation priorities, including the Office of Environment and Heritage’s Biodiversity Investment Opportunities Map – this map identifies areas for investment within the Cumberland subregion, which include either core areas or biodiversity corridors of state or regional significance.
If you are interested in obtaining further information look out for developments on council’s website.
Adani Coal Mine – Surely it Can’t Go Ahead
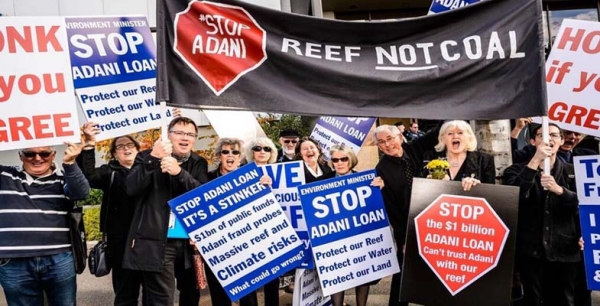
The Australian and Queensland governments are still pushing for the Adani mine to go ahead and are bending over backwards to make this possible. The local native title holders are opposed but the Australian government is trying to legislate away the aboriginal rights.
We still haven’t heard if the Northern Australia Investment Facility will provide a concessional loan of $1 billion to finance the rail line from the Carmichael Basin to the port at Abbot Point on the Great Barrier Reef.
Queensland has offered financial inducements such as the deferral of royalty payments and no payment will be required for the mega litres of water that will be drained from the Great Artesian Basin. Local farmers are concerned about the effect on their water supplies.
Adani has announced a decision to go ahead in principle. But where will the finance come from when already 16 major banks have declined to participate? They can see that the project is not viable. When will reality hit the politicians?
There are many reasons why the mine will be a disaster:
- Adani has a dubious record that is hard to pin down due to complicated corporate structures and use of offshore tax havens.
- The chief benefit being promoted is jobs, jobs, jobs but realistic figures are for only about 1,500 full-time equivalent direct and indirect jobs as against the hype of 10,000 jobs.
- The Minister for Resources and Northern Australia, Matt Canavan, claims that the coal will bring the Indian peasants out of poverty. But solar energy has been shown to be more affordable.
- The mine is a total environmental folly. The opening of the Adani mine and construction of the railway line will open up the whole Galilee Basin that contains enough coal which, if burned, could blow away any hope of keeping global warming within 2°C and undermine any national and state action to tackle climate change.
- The mine threatens the Great Barrier Reef not only because of the increase in sea temperatures from climate change. The recent heavy rains led to coal washing into wetlands next to Abbot Point, the coal loader leased to Adani. Is this an example of worse to come?
- The mine would harm the economy of other coal mining states. The massive increase in production would reduce the coal price for coal mined in the Hunter Valley.
- The current rapid move to renewable energy is likely to reduce demand for coal to the extent that the coal market will collapse. The governments’ support could well be wasted.
Rodent Eradication on Lord Howe Island – A Case Study of Cost Benefit Analysis
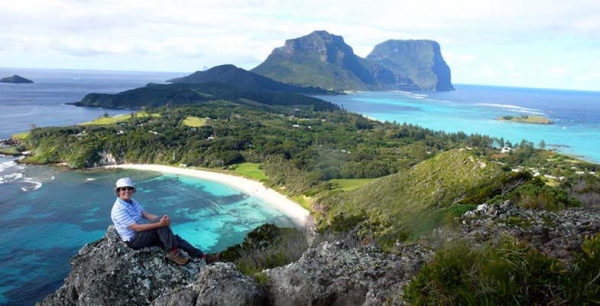
Lord Howe Island is a magnificent island about 600 km off the coast of NSW. Its unique landform as an eroded volcanic peak and endemic biodiversity led to its classification as a World Heritage site. The southern end is dominated by the basalt peaks of Mt Gower (875 m) and Mt Lidgbird (777 m) covered in dense forests. The northern end is undulating and partially cleared for settlement. Lord Howe’s crescent shape embraces a sheltered lagoon and the southernmost coral reef on the planet.
The number of residents and visitors is limited by its small size and mountainous topography. Its economy depends on tourism and propagation and export of the kentia palm. The maximum number of tourists on the Island at any one time is constrained to 400 and the number of residents is about 350.
When I last visited the island in 2002 there was talk of a project to eradicate rodents. Rats and mice arrived in 1918 as escapees from a grounded ship. Rodents have contributed to the extinction of a number of species and are recognised as a threat to at least 13 bird species, 2 reptiles, 51 plant species, 12 vegetation communities and numerous threatened invertebrates.
The problem is that there is no native mammal species on the island that can compete with, or predate, on the rats and mice. Any impact on the natural values of the island diminishes tourism and recreation values since these are inextricably linked to the islands unique biodiversity and World Heritage values. (Attempts have been made to bring in other predators that are another example of the problems humans can cause when we interfere with nature – see the end of this article.)
Predation by rodents on kentia palm production reduces values associated with this commercial activity, via reduced production and added costs. In addition, rodents impose costs to residents and tourism operators via the need to bait to reduce visual presence of rodents, the spoiling of food stuffs and potentially health impacts to residents and tourists alike.
There has been a long process of investigation and consultation with concerned residents and I understand that the issues are still not resolved. The main problem is the acceptance of widespread use of poison baits. It is hoped that final approval will be granted later this year. The ABC Radio National Off Track program had two episodes on Lord Howe Island’s ecology during early June including discussion of the project and the damage being done by rats.
I recently discovered one of the reports on the project. The Economic Evaluation of the Lord Howe Island Rodent Eradication Project prepared by Gillespie Economics (November 2016). It is an interesting example of cost benefit analysis, the sort of analysis expected by government. As expected with an economic evaluation the report covers the financial aspects of the project. But it is also tries to quantify other community and environmental effects that cannot be directly related to money using some of the techniques of environmental economics.
Cost Benefit Analysis
Cost benefit analysis (CBA) provides a comparison of the additional costs and benefits with the rodent eradication project (REP), relative to without the REP. Provided the present value of additional benefits exceed the present value of additional costs, a project is considered to improve the wellbeing of society and hence is desirable from an economist’s point of view.
The net present value of a benefit or cost arising in the future takes into account the value of time through the process of discounting. The discount rate is a huge area of controversy. Business and government usually use commercial interest rates while society may consider a much lower rate is appropriate so that the interests of future generations are not discounted using the questionable theory that they will be better off than current generations.
A prime example is the issue of climate change – some argue that the costs borne in transitioning to renewable energy sources now do not justify the benefits of avoiding the loss of crops, bushfires, heat stress, sea level rise 50 or 100 years hence. If the benefits of avoiding costs in the long term are discounted at commonly used interest rates then the costs of transition today may exceed these benefits. Part of the problem is the broad assumptions needed to value loss of biodiversity and other environmental assets. The REP project analysis provides some examples of surrogate methods that are used. I will leave the reader to decide on the validity of the methods.
Scope of the REP
The Lord Howe Island Board currently implements a limited rodent control program at a cost of $85,000 per year. However, it is not reducing the rodent population sufficiently to limit landscape scale ecological impacts and there is a risk that continuation of the current approach will result in bait shyness and/or resistance in the rodent population.
The Lord Howe Island REP will use cereal baits laced with the anticoagulant Brodifacoum dispersed from helicopters in the uninhabited areas, and a combination of hand broadcasting, bait stations and bait trays in the settled area. Preparation is required to ensure some species are not killed by the baits. The iconic woodhens that were rescued from extinction and the local currarongs will have to be captured and caged for the period the baits are potent.
Without the REP, the current rodent control program would continue but this can only cover accessible areas of the island. The rodents have plenty of food sources all over the island. There would be continued presence of poison in the environment, continued impacts on the kentia palm and nursery industry, further degradation of World Heritage values (including endemic and threatened species) and the potential for Lord Howe Island to be inscribed on the List of World Heritage in Danger.
Cost Benefit Analysis Results
The analysis calculates that the present value of costs of the project and follow up management including measures to return species that are currently extinct from the island over 30 years is $9 million. By contrast the value of the benefits is $150 million. Hence this analysis shows that the economic value of the project is obvious.
Just looking at the cost of the project compared with ongoing costs of the current methods of control the net cost is about $8 million. Funding commitments have already been received from the NSW and Australian governments.
The removal of the effects of rodents on the kentia palm industry and vegetable production is valued at $1 million.
Some of the valuing of the benefits would be subject of much debate, for example:
- The improvement in biodiversity is deemed to increase visitor numbers. In warmer months when accommodation is already fully booked, increased demand is assumed to increase prices by 35%. In cooler months the accommodation demand is assumed to increase by 20% and prices by 7%. All this is assumed to have a present value over 30 years of $80 million.
- It is estimated that seven future extinctions will be avoided. The value of extinction prevention is based on several studies of community willingness to pay for the protection and recovery of threatened species. On an Australia-wide measure of community willingness to pay they are valued at $8 million each adjusted for a chance that the REP makes no difference to the chance of extinction to give a total of $40 million.
- There are also four species that are locally extinct, the Kermadec petrel, the white-bellied storm petrel, phasmid (stick insect) and wood-feeding cockroach. The return of these species is valued similarly with a deduction for the possibility of failure to reestablish the species at $27 million. One wonders if the general public would value the return of a species population by a transfer from another island in the same way as prevention of extinction of the only population of a species.
Even though some of these figures are debatable it is clear that the REP is worthwhile from an economic point of view. It is hoped that the local residents can be convinced of the benefits.
 A Further Complication – the Masked Owl
Not long after rats became a problem the authorities thought it was a good idea to introduce various owl species to control the rats. There is still a large population of Tasmanian Marked Owls. After the REP is completed their major food source will have disappeared so it is likely they will turn to other species. We don’t want more extinctions so a removal program will be required of these Masked Owls.
City Populations

There has been much media interest in the report that Sydney's population has reached 5 million. What has also been reported is that Melbourne’s population is growing faster than Sydney’s and may soon exceed it.
Sydney
The problem I have with this is that Sydney includes the Central Coast and the Blue Mountains, but not Wollongong. I don't advocate including Wollongong but leaving out the other two plus the Wollondilly Shire (Picton) we have 5.25 – 0.33 – 0.08 – 0.05 = 4.79 million. We could go further and leave out the farther reaches of Hornsby, Baulkham Hills and other local government areas.
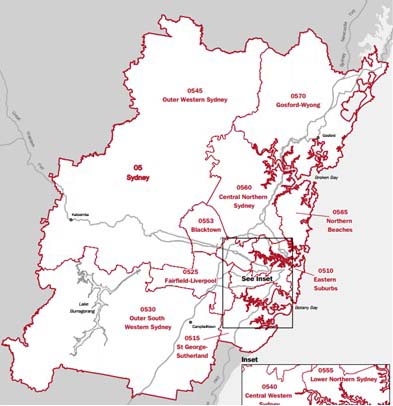
Melbourne
Melbourne includes the Mornington Peninsular (0.16 million) which is debatable. Other areas should also be removed (allow 0.05 million). So, 4.67 – 0.16 – 0.05 = 4.46 million which is 93% of Sydney’s population.
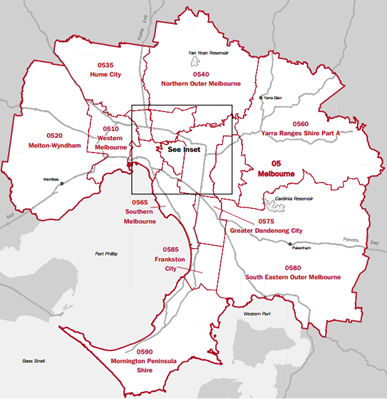
Distortions
Part of the problem for the Australian Bureau of Statistics is that the outer suburban local government areas cover large areas of peripheral rural land. The Sydney map at a guess is at least 75% rural and this leads to massive distortions when people try to compare densities.
This data below (from Population Australia) is rubbish. Population Australia is a website specialising in research for Australia population growth trends and estimation. It is not clear who is behind this group but the data seems to be coming from the Australian Bureau of Statistics.
More on this some other time.
Position | City | Population density |
1 | Melbourne | 453/km2 |
2 | Adelaide | 404.205/km2 |
3 | Sydney | 400/km2 |
4 | Perth | 317.736/km2 |
5 | Canberra | 173.3/km² |
6 | Brisbane | 145/km2 |
7 | Hobart | 124.8/km2 |
8 | Darwin | 44.976/km2 |
Jim Wells has been delving into published statistics that are more than meets to eye.
Threatened Species Children’s Art Competition

STEP is supporting a great initiative by organised by Forestmedia, a small not-for-profit organisation that is aiming to increase community awareness of the plight of our threatened species and help to develop the next generation of environmental leaders. The children’s art competition is supported by a number of organisations including the National Parks Association, the Nature Conservation Council, WIRES, Featherdale Wildlife Park, Humane Society International, Animals Australia and Taronga Zoo.
The competition is open from 5 June to 4 August to all primary aged children in NSW and the ACT. Fifty finalists’ works will hang in a two week exhibition in September at the Botanic Gardens and Surry Hills Community Centre, with winners announced on 7 September, Threatened Species Day.
There will be prizes in several categories. STEP is sponsoring a prize for a nocturnal animal artwork. Last year’s prize winners are shown on the website. They are very impressive.
Biodiversity Legislation Submission – Major Points for Comment Relating to Urban Areas

In May the NSW government released regulations and codes that provide some of the detail on how the biodiversity legislation will operate in practice. But it is not complete so there is still a lot of uncertainty. The call for submissions is an opportunity to express a view on what should be in the areas that are missing as well as the available drafts.
There is a large volume of information to digest. The most useful one is the Submission Guide: Ecological Sustainable Development.
Consistent with STEP’s interests we focus on the aspects that relate to the management and preservation of urban bushland. Refer to our article on the issues regarding the Biodiversity Offsets Scheme.
The major areas that are missing are the Vegetation State Environment Planning Policy (Vegetation SEPP) and some of the maps that will underpin the decision-making process. This is most unsatisfactory! The legislation is due to come into force on 25 August. It is an abuse of due process to be conducting consultation on incomplete information.
The Vegetation SEPP will regulate clearing of vegetation in urban areas and environmental conservation/management zones where clearing does not otherwise require development consent under the main planning act, the Environmental Planning and Assessment Act. So the zones that are covered include E2, E3 and E4 zones.
The major concern is the inclusion of E2 zones in the clearing provisions. This zone is for areas with high ecological, scientific, cultural or aesthetic values outside national parks and nature reserves. The zone provides the highest level of protection, management and restoration for such lands whilst allowing uses compatible with those values.
E3 (environmental management) and E4 (environmental living) zones accommodate low-impact residential development but contain, or are near, bushland so have particular environmental or risk factors.
So why is the Vegetation SEPP regulating clearing on E-zone land, in particular E2 land? Clearing should not be allowed except for bushfire safety and other protection reasons.
Examples of land that could come under the new regulations are near the Blue Gum High Forest area in Dalrymple Hay Reserve and the area between Berowra Heights and Cowan near the Great North Walk. Most people assume the latter is national park but much of the natural scenery enjoyed by walkers is zoned E2, E3 and even RE1 (public recreation) and would have little protection under the proposed SEPP. Some E2 land is protected by being a BioBanking site or part of a conservation agreement, but not all.
Sensitive Biodiversity Values Land
There are certain areas, regardless of land area, that will require a biodiversity assessment (and offsetting if clearing is approved) if they are mapped in a Sensitive Biodiversity Values Lands map. The definition of areas included is very restricted.
Comment for submissions
The final map is not available and we understand many parts of NSW have not been properly assessed yet.
The resolution of the draft map on the website is too low to identify particular sites.
Areas that don’t meet the definition and should be included are endangered ecological communities (e.g. Sydney Turpentine Ironbark Forest and Duffys Forest EECs), buffer zones around EECs and areas of critical habitat, e.g. Ku-ring-gai Flying Fox Reserve.
Will it be possible to nominate areas for inclusion? Local land managers should be able to have a say on what is Sensitive Biodiversity Values Land.
There is a real danger that clearing of EECs such as STIF could rapidly turn it into critically endangered. A council’s discretionary DCP would be the only protection. It takes some time for a change in classification of vegetation communities to be finalised. In the meantime will they be cleared beyond hope of recovery?
Clearing Provisions
The clearing provisions are determined by categories of development.
Development consent required
Development consent is required (under the Environmental Planning and Assessment Act) for larger developments and infrastructure.
The Biodiversity Assessment Method (BAM) applies to clearing and the flawed offset provisions will apply.
Development consent NOT required
When development consent is NOT required, e.g. clearing of undeveloped land, the Biodiversity Offset Scheme (BOS) thresholds apply as prescribed below:
Minimum lot size | Proposed area of clearing |
Less than 1 ha (10,000 m2) | 2,500 m2 or more |
Less than 2 ha | 5,000 m2 or more |
2 to 39 ha | 5,000 m2 or more |
The thresholds are high.
For clearing above the threshold the BOS applies and approval will be determined by the Native Vegetation Panel. A biodiversity offset obligation will be imposed. Local councils could be given authority to do this assessment. We don’t know who will be appointed to the Native Vegetation Panel.
Clearing below the threshold will be regulated under the local council’s Development Control Plan (DCP) through a permit system. This will be the most likely situation in urban areas,
There is currently wide variation in the standards of DCPs, for example in relation to individual trees. Ku-ring-gai requires a permit for clearing of most native trees and vegetation and non-native trees while Hornsby only controls clearing of locally endemic native trees or trees in heritage zones. It is possible that the government will impose standard clauses in DCPs. Indeed would these be desirable if a high standard is applied?
Comment for submissions
It is essential that the objectives of clause 5.9 of the standard LEP are carried over to DCPs under the new scheme that is ‘to preserve the amenity of the area, including biodiversity values, through the preservation of trees and other vegetation’.
Submissions should explain desirable standards for the DCP regulations. One area that has not been covered is how the DCP clearing codes will fit in with the need for wildlife corridors and the Greater Sydney Commission’s guidelines for the Green Grid and minimum tree canopy cover.
Other Impacts of Clearing Regulations
A major issue with the local regulation of clearing is that there will be no monitoring of loss of vegetation communities and assessment of cumulative impacts. There needs to be a database of regional clearing approvals.
There is uncertainty about the legal status of DCP regulations and the ability to prosecute if breaches occur.
Areas of western Sydney that will be subject to the greatest amount of new development need as much protection as possible of native vegetation and habitat. The Cumberland Plain Woodland has already had large areas cleared. The allowable clearing and the use of offsets under the proposed regulations will further reduce the area of remaining native vegetation and habitat.
Conclusion
Given the limited areas of bushland in urban areas, it is inevitable that there will be more losses of irreplaceable biodiversity. The offsets provisions do not adequately factor in the scarcity of suitable offsets in urban areas (see article below). The rules must be amended to ensure maximum protection of native vegetation in urban and E zones, particularly areas containing threatened species.
Please Send a Submission
Closing date: Wednesday 21 June. Lodge online or post to Land Management and Biodiversity Conservation Reforms, Office of Environment and Heritage, PO Box A290, Sydney South, NSW 1232.
Assessment of Biodiversity Offsetting – A Fail and Worse to Come
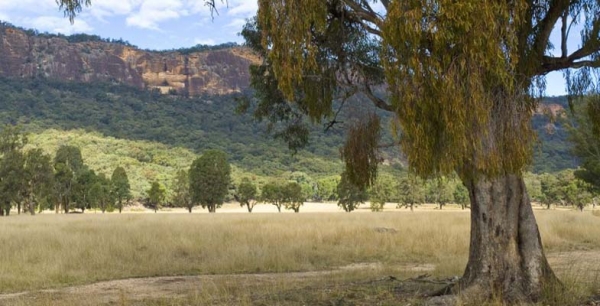
Over the past 200 years NSW has lost almost half of its bushland through land clearing and only 9% of what is left is in good condition. Clearing of native vegetation and habitat modification are the greatest threats to the survival of the majority of species on the threatened list.
The biodiversity laws that the government passed in late-2016 place a great deal of emphasis on offsetting as a means of allowing development to occur. The theory is that biodiversity lost when clearing for a development can be replaced by providing for restoration or protection of biodiversity in another place.
The Nature Conservation Council recently published a report on the operation of NSW’s biodiversity offset schemes, called Paradise Lost: The Weakening and Widening of NSW Biodiversity Offsetting Schemes, 2005–16. This article outlines the key findings of the report.
As you can tell from the title, the principles of offsetting have been severely compromised. We can expect worse to come under the new laws.
Concept of Biodiversity Offsetting
Biodiversity offsetting has been in use in NSW since 2005 under various pieces of legislation.
One example is the money that was paid by NSW Transport Infrastructure Development Corporation to compensate for the loss of 0.33 ha of Blue Gum High Forest when the railway station at Hornsby was expanded. The money was used to help purchase land to expand the area of protection of Blue Gum High Forest next to Dalrymple-Hay Nature Reserve.
The basic principles that should be observed are given below.
Offsets hierarchy
Offsets should only be used after appropriate avoidance and minimisation measures have been taken according to the mitigation hierarchy. A biodiversity offset is a commitment to compensate for significant residual adverse impacts.
No net loss
A biodiversity offset should be designed and implemented to achieve measurable conservation outcomes that can reasonably be expected to result in no net loss and preferably a net gain of biodiversity.
Some areas should be off limits – red flags
There are situations where residual impacts cannot be fully compensated for by a biodiversity offset because of the irreplaceability or vulnerability of the biodiversity affected.
Consider whether restoration is possible
Biodiversity offsetting assumes ecosystems and habitats can be re-created. This is often not the case, particularly if offset sites have been highly degraded and lost essential characteristics. In Australia, a number of studies have shown revegetated areas rarely resemble the ecosystem it was intended they would replicate.
Timing mismatch
It takes some time for species to establish a viable population in a new habitat. Offsetting should allow for a phased-in approach to prevent the total loss of species that are already threatened. The loss of hollow-bearing trees is a particular example.
Stakeholder participation
In areas affected by the project and by the biodiversity offset, the effective participation of stakeholders should be ensured in decision-making about biodiversity offsets. All stages including their evaluation, selection, design, implementation, monitoring and communication of results to the public should be undertaken in a transparent and timely manner.
Long-term management
The design and implementation of a biodiversity offset should be based on an adaptive management approach, incorporating monitoring and evaluation, with the objective of securing outcomes that last in perpetuity.
Case Studies
There are five types of offsets schemes operating in NSW. The performance of each of these schemes was examined through the lens of eight case studies:
- Namoi catchment property vegetation management plans – approval for land clearing under the Native Vegetation Act
- Kellyville in northwest Sydney – creation of credits under the BioBanking scheme
- Wagga Wagga local environment plan – biodiversity certification for strategic planning
- Albury local environment plan – biodiversity certification for strategic planning
- Huntlee development in Hunter Valley – Office of Environment and Heritage principles for biodiversity offsetting
- Boggabri and Maules Creek coal mines – development consent – Office of Environment and Heritage principles for biodiversity offsetting
- Warkworth mine extension – Office of Environment and Heritage principles for biodiversity offsetting
- Mt Owen mine expansion – NSW biodiversity offsets policy for major projects
The report provides a detailed description of the features of each case study and compares them with the expected standards. The criteria for the analysis were:
- be a last resort after avoidance and mitigation (including appropriate ‘red flags’)
- deliver biodiversity equivalence (like-for-like)
- provide security and achieve benefits in perpetuity
- deliver a net gain in biodiversity
- be additional to conservation measures already in place
- be enforceable, resourced and well-managed
- be subject to a rigorous monitoring and evaluation framework
- be open and transparent
It was demonstrated that biodiversity offsetting is failing to deliver the environmental outcomes promised. No case studies resulted in outcomes deemed ‘good’ and the outcomes were:
- ‘disastrous’ in one study (Boggabri/Maules Creek)
- ‘poor’ in five studies (Warkworth, Mount Owen, Huntlee, Albury, Kellyville)
- ‘adequate’ in two studies (Namoi, Wagga Wagga)
For more details read the report.
Comparison of Offset Schemes
The report considers that a scheme should have the following features:
- excludes discounting of offset credits
- excludes supplementary measures
- excludes mine rehabilitation
- clear standard for environmental outcomes
- does not allow payment in lieu of offsets
- red flags
- impacts on water quality and soil are taken into account
- like-for-like offsetting
The case studies demonstrate the features of the five biodiversity offset schemes in operation. It was found that the later models contained fewer best-practice principles and standards than the earlier ones:
- only the first offsets scheme (the Environmental Outcomes Assessment Methodology under the Native Vegetation Act) contained all eight features
- the Biodiversity Offsets Policy for Major Projects introduced by the Baird government in 2014 contained only one of the eight features
Overall, biodiversity offsetting schemes have failed to deliver the promised outcomes and they have become weaker as standards have slipped.
Draft Biodiversity Offset Scheme is Even Worse
The latest Draft Biodiversity Offset Scheme (BOS) and the Biodiversity Assessment Methodology (BAM) that will be used to determine offsetting does not include any of the features described above.
The BAM is a metric-based tool that allows biodiversity impacts and improvements to be assessed and quantified in terms of ecosystem credits and species credits, collectively known as biodiversity credits that will need to be offset.
The proponent can choose to between three methods of meeting their offset obligation:
- buying credits for a suitable site under the offset rules from the market, or they can establish a Biodiversity Stewardship Agreement on their own land and retire the credits generated
- make a payment to the Biodiversity Conservation Trust that will source the offsets
- paying for conservation actions as approved by the consent authority
Key points for submissions
The key points on the features that should be in the offsetting legislation and the changes that are needed are listed below.
1. Discounting of biodiversity credits should not be permitted
The government proposes introducing ‘discounting’ that will allow offset credit requirements to be ‘discounted’ based on claimed social and economic benefits. Economic prioritisation policies are likely to contribute to the incremental and permanent loss of significant biodiversity in NSW, and undermine the credibility of the policy.
2. Supplementary measures should not be included
The BOS allows the use of ‘biodiversity conservation actions’ that may include research or surveys into the biodiversity under threat. This is not a genuine offset. The Scientific Committee stated in a report on this idea that this:
… is clearly a case of developers being able to buy themselves out of any obligation to protect biodiversity in any meaningful way.
NSW Scientific Committee (2014) Submission on the Draft NSW Biodiversity Offsets Policy for Major Projects
3. Allowance of mine rehabilitation
Numerous critics have questioned whether degraded mine sites can be effectively restored and in any case mine site rehabilitation should be an obligation of the mining company. Recently, developers have been permitted to use mine rehabilitation sites to generate biodiversity offset credits. The government proposes continuing this practice under the draft BOS.
4. Clear standards
The Biodiversity Conservation Act requires that the biodiversity assessment method should adopt a standard that result in no net loss but the draft BAM does not have a clear objective to protect biodiversity.
5. No payment in lieu
The draft BOS would allow proponents to discharge offset requirements simply by paying money into Biodiversity Conservation Trust. The development could proceed without certainty that the required offset is possible.
6. Red flags
The BOS does include some restrictions on proposals that cause ‘serious and irreversible impacts’ (SAII) but the criteria for defining SAII are too weak. It includes only the most endangered and restricted area species and ecological communities. In the case of major projects the SAII risks can be ignored. The net effect will be that EECs and endangered species not listed in the list of SAIIs, e.g. STIF and Duffys Forest, could be cleared without offset requirements if the land area is below the clearing thresholds. A council’s discretionary DCP would be the only protection.
7. Other impacts on water and soil
Other impacts should be considered in the BAM. The assessment methodology covers only a limited range of biodiversity values such as vegetation integrity and habitat suitability but not soil health and water quality and availability.
8. Like-for-like principle
The like-for-like principle that offsets should replace the values being lost is undermined in several aspects. For example:
- Offsets can be found from a radius of 100 km. It will be easier and cheaper to find offsets outside urban areas undermining preservation of biodiversity and threatened species and EECs such as STIF. The loss of existing geographic distribution if sites in urban areas are lost will undermine species resilience and long term adaptation to climate change.
- Offsets can be used for species across similar vegetation classes or between species. This even applies to threatened species; a koala can be swapped for a wallaby.
Conclusion
The government is proceeding with this model despite warnings expressed by leading scientists, lawyers and conservationists. The government basically has ignored the advice of the experts because it is wants to deliver development at any cost. Implementing the BOS will in fact add extinction pressures to the very species and ecological communities it is supposed to protect by facilitating the more rapid and widespread destruction of threatened species habitat across NSW.
Please Send a Submission
Closing date: Wednesday 21 June. Lodge online or post to Land Management and Biodiversity Conservation Reforms, Office of Environment and Heritage, PO Box A290, Sydney South, NSW 1232.
Some ways Citizens can Help Science
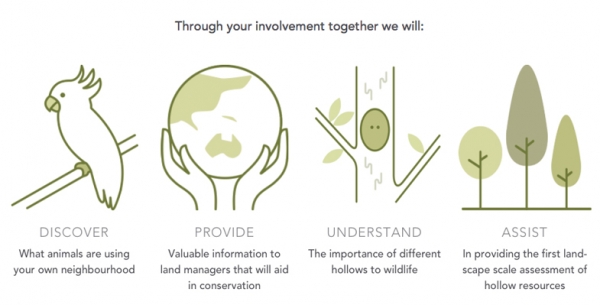
Hollows as Homes
The Australian Museum has joined the Royal Botanic Garden Sydney and Sydney University in launching a new citizen science project called Hollows as Homes. Funding support is provided by the Australian government.
The project builds on the Cockatoo Wingtags project and involves the same researchers, led by Dr John Martin.
In urban and agricultural areas large, hollow-bearing trees are in decline, but many species of animal rely on tree hollows for shelter and breeding.
In NSW, hollow-dependent species include at least 46 mammals, 81 birds, 31 reptiles and
16 frogs. Of these, 40 species are listed as threatened with extinction. This is why the ‘loss of hollow-bearing trees’ has been listed as a Key Threatening Process to biodiversity throughout Australia.
One reason that their loss is significant is the length of time that it takes for a tree hollow to form (often more than 100 years). More hollow-forming trees are needed to replace the losses that have occurred already. The solution being trialled is to create artificial hollows and nest boxes.
The Hollows as Homes project aims to conduct the first landscape scale assessment of tree/nest box/cut-in hollow distribution, type and wildlife use. Data generated will inform council plans for retaining important habitat trees, planting future habitat trees and supplementing missing habitat.
The project will harness the enthusiasm of local residents to report, measure and monitor tree hollows in their backyards, streets and parks.
Participating is easy – check the trees in your backyard, street, park, paddock or the bush, and report the hollow(s) online.
FeralScan
Feral animals cause over $720 million damage each year in Australia and threaten our native wildlife. FeralScan allows you to help reduce feral animal damage by mapping feral animal sightings, damage and control activities in your local area.
Ferals covered by the program include Indian Mynas, foxes, rabbits, feral cats and many more invasive species.
Gas is not the Solution for Transitioning our Energy Supply away from Coal

Following the serious power blackouts that occurred in South Australia and near misses in other states, gas-fired power stations have been touted as the one of the best means to transitioning away from our aging coal-fired electricity generation system. This is short-term, simplistic thinking that will be detrimental in the longer term, and the Climate Council has just released a report explaining why. The report is called Pollution and Price: The Cost of Investing in Gas.
The Climate Council is the crowd funded organisation led by Tim Flannery that replaced the Climate Commission that was abolished by the Abbott Government shortly after they came into power. They aim to provide independent, expert information on climate change issues.
Here is a brief summary of the main findings.
Use of gas does not reduce emissions sufficiently
Australia must reduce greenhouse gas emissions down to zero by 2050 in-line with international goals. Fossil fuels (coal, oil and gas) all produce greenhouse gas emissions driving climate change. Limiting global temperature rise requires that they are all phased out. Gas is not sufficiently less polluting than coal to garner any climate benefit.
Greenhouse gas emissions are produced both from gas power stations and gas production (for instance, methane from gas leaks). Methane is 86 times more potent as a greenhouse gas than carbon dioxide over a
20-year period.
New gas power plants are less polluting than coal. However, when the entire supply chain of gas production is considered, gas is not significantly less polluting than coal. Current levels of reliance on gas power in Australia must be reduced to play our role in limiting global temperature below 2°C. Expanding gas usage is inconsistent with tackling climate change as it locks in emissions for decades into the future.
Greater reliance on gas will drive higher power prices
Australia’s liquefied natural gas exports are pushing up the price of gas power as domestic gas prices are now inextricably linked to world market prices for oil. This will continue into the foreseeable future.
The most economic and accessible reserves are now being exported. Further gas expansion will drive increased reliance on unconventional gas, which is expensive. Reliance on gas power is also driving power price spikes, particularly in South Australia, Queensland and increasingly in New South Wales, due to lack of competition among gas power companies.
Investment in new gas plants is financially risky
The large increases in future gas prices and volatility resulting from liquefied natural gas exports together with domestic gas prices controlled by relatively few producers, make investments in new power plants using gas very risky. New gas power plants would rely on ageing gas production infrastructure (e.g. processing plants and high pressure pipelines) that is increasingly vulnerable to failure. Costs of updating this infrastructure and accounting for methane leakage must be factored into policy and investment decisions.
New gas infrastructure locks in carbon emissions for decades. Future regulations may impose higher costs or stricter limits on emissions in the future, impacting on the economic viability of gas production and electricity generation, stranding investments.
Significant development of new gas plants is unfeasible without a massive expansion of unconventional gas
The sheer volume of gas required, the cost, the lock in of long-term emissions, environmental risks and lack of support from communities near gas wells makes this unrealistic. Currently the emissions from unconventional gas in Australia are unknown due to a lack of measurement and data. This presents a long term carbon risk to investors as high emissions fossil fuel infrastructure faces the possibility of future regulation due to climate change. Development of new unconventional gas is entirely out of step with meeting the Australian government’s climate change goals.
Renewable energy can provide a secure, affordable alternative to new fossil fuels
New renewable energy is cost competitive with new gas. The cost of renewable power and storage, particularly solar, wind and batteries, continues to fall and has no associated fuel costs. This contrasts with rising and volatile gas prices.
Technologies such as solar thermal, hydro and biomass plants can meet demand for electricity at all times of the day as well as meeting technical requirements for grid stability. Combining these technologies with wind, solar PV, and large-scale energy storage, can meet electricity demand round-the-clock. Using existing gas-fired generators and supply infrastructure prudentially to complement wind and solar power while scaling up a range of renewable energy technologies, energy storage and energy efficiency measures could deliver a limited benefit, provided the end goal is phasing out the use of all fossil fuels as quickly as possible.
Conclusion
The report concludes that Australia should not provide policy support for new gas power plants or gas supply infrastructure. Existing gas plants should be thought of as a short-term, expensive, emergency backup as renewable energy and storage is rapidly scaled up.
Bubbles not Balloons

Every day there’s an outdoor event to celebrate or commemorate something or other, and balloons will be released. It looks spectacular for a moment or two, but they’re soon forgotten. What happens to them? Most end up in our seas, where they are eaten by marine wildlife, including seabirds. It sounds frivolous, but it’s become a major conservation problem.
BirdLife Australia has thrown its support behind a campaign by Zoos Victoria and the Phillip Island Nature Parks to shine a spotlight on this issue.
Most people aren’t even aware that the simple act of releasing balloons into the air poses a major danger to wildlife. However, the facts are startling. A CSIRO study found that balloons are in the top three most harmful pollutants threatening marine wildlife – along with plastic bags and bottles.
Albatrosses, cormorants, penguins and pelicans are all affected by this, but of all Australia’s seabirds, shearwaters, or muttonbirds, are the most badly affected when it comes to ingesting plastic debris.
For example, the decline of Flesh-footed Shearwaters on Lord Howe Island has been directly linked to the ingestion of debris, with balloons and their plastic attachments, one of the most prevalent and readily identifiable items found inside them. Further, two separate studies have found that 100% of Short-tailed Shearwaters contain plastic in their digestive systems.
The balloons fill the birds’ digestive tracts while offering no nutrition, and slowly poison them as toxic chemicals leach into the birds’ tissues.
Birdlife Australia is joining Zoos Victoria and Phillip Island Nature Parks to encourage Australians to make their outdoor events wildlife-friendly. The best way to do this is by choosing to use bubbles instead of balloons to reduce this source of harmful waste.
Help spread the word to use bubbles instead of balloons at outdoor events. It’s a simple act but it can make such a big difference.
This information comes from Birdlife Australia.
Further reading:
St Ives Showground Precinct – a Tourism Centre for Ku-ring-gai?
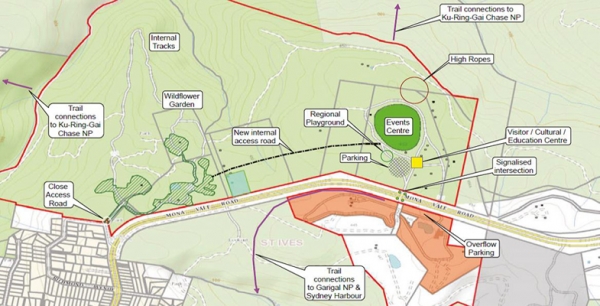
Ku-ring-gai Council has commissioned a report on developing the tourism potential of the municipality. Ku-ring-gai Destination Management Plan 2017 to 2020 is open for submissions until Friday 12 May.
The report focuses on a plan:
… to redevelop the St Ives precinct to achieve a ‘wow factor’ to attract visitors, benefit residents and help grow the local visitor economy.
The aspirations presented in the report are:
- to develop the precinct as a distinctive destination for nature-based and Aboriginal cultural tourism experiences
- to establish the precinct as a unique trekking hub and gateway for adjoining national park trails and Hawkesbury River to Sydney Harbour linkages to achieve similar iconic status as the Three Capes Track in Tasmania
- to develop events infrastructure and supporting facilities to position the precinct as centre for international-standard performances similar to those staged at the Hope Estate in the Hunter Valley for music, cinema and performing arts
- to rebrand the precinct to reflect its competitive advantage and world-class potential (e.g. Centennial Parklands and Western Sydney Parklands)
- to commission a revised master plan to balance existing recreational and community activities with a new tourism focus under a trust governance model used elsewhere
- to achieve the precinct’s full potential as a seven day a week, four seasons integrated mixed-use destination for international and domestic visitors
Accommodation Proposals
The possible developments described are more prosaic. Many of the suggestions are for the upgrading of existing facilities but STEP would be concerned by proposals for:
… unique accommodation experiences that complement these experiences (e.g. a five-star eco-tourism lodge sited near the boundary of the national parks escarpment, hostel accommodation for education and recreation groups and flash-camping).
Details are needed on how this sort of development can be achieved without damaging the environmentally sensitive E2-zoned land including endangered the Duffys Forest Ecological Community. The map at the top of the page also seems to show some national park land as being within the precinct. STEP will be looking at these plans very closely.
The report does acknowledge the environmental constraints:
It should be recognised that the recommended strategy, focused on nature based and Aboriginal cultural tourism, has environmental protection and enhancement at its core. There are numerous examples around the world of sensitively designed accommodation and infrastructure within and adjacent to national parks and areas of high ecological value. It is proposed that all new development in the St Ives precinct will be sensitively designed, constructed and operated in accordance with best practice and there should be a net improvement to environmental performance on site such as increased biodiversity, improved drainage runoff, Aboriginal cultural interpretation and signage. It should also be appreciated that many parts of the St Ives precinct are in a degraded environmental condition.
Walking Tracks
Proposals to upgrade walking tracks within the precinct and links to Ku-ring-gai Chase and Garigal National Parks are welcome. Many of the existing tracks are degraded and unattractive because of weed infestations. Funding has always been a problem, both for council and National Parks and Wildlife Service. This highlights the perennial problem, where will the money come from? It seems that public private partnerships and commercial leases are the only hope.
National Parks Development
The report (p19) states that the NSW government is about to release a new master plan for national parks covering partnerships with nature-based tourism stakeholders. A draft new Plan of Management for Ku-ring-gai Chase National Park is due to be released this year. It is going to be another busy year for preparing submissions.
Old Nursery Site
The plan for an indoor sports centre at the site of the nursery does not get a mention. Has that idea fizzled out? Instead there is mention of a native wildflower nursery funded by the private sector.
Road Links and Parking
The report highlights the need for traffic lights and a pedestrian crossing at the main entrance on Mona Vale Road. It also suggests that the exit at the Wildflower Garden be closed with internal roads being used to gain access via the main showground. There is a suggestion for overflow parking on the other side of Mona Vale Road. The effects of car parking on the Duffys Forest vegetation and soils has always been a problem and is currently controlled by the use of bollards and parking restrictions. If the number of visitors is to increase significantly the control of parking will be more important than ever.
Development of Crimson Hill, the Old UTS Site
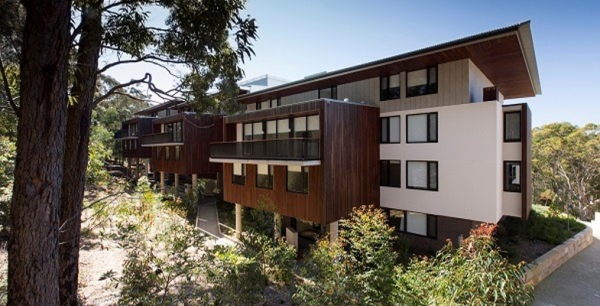
Firstly, some history; in 2003 UTS decided to vacate the site and sought a rezoning for residential development with 560 buildings. Ku-ring-gai Council refused the application so the state government intervened and declared the site to be a Part 3A project under the EPAA Act. The Minister for Planning became the decision maker.
STEP was a member of a community consultative committee established to demonstrate that the community had been consulted. The committee opposed many aspects of the development plan. There were some wins in the transfer of 9 ha of the land to management by Lane Cove National Park and some improvements including a reduction in the number of dwellings approved for the site, the retention of a full-sized oval for community use and the retention of heritage buildings.
Of course there are no additional funds available to the NPWS to manage the additional national park land. A significant area of bushland has been modified to establish the asset protection zone and of course there will always be traffic and parking problems especially when the new school is operating. The management of stormwater and the risk of weed encroachment will need to be closely monitored.
Crimson Hill – Defence Housing Australia (DHA)
Crimson Hill estate was designed along simple, environmentally sound principles aimed to establish a new integrated community connected by bushland trails and elevated walkways. The objective was to promote community interaction and well-being. It has 345 dwellings occupying a portion of the 12.6 hectare site of rezoned land that DHA purchased from UTS in March 2011.
A significant area of this land, including publicly accessible bushland and nature trails for bushfire management, is in the care of the new residents via a Community Management Association.
It is DHA’s first multi-residential housing project and is being constructed in five phases. The name is a salute to the colour of the ribbon on the Victoria Cross medal. Each residential precinct is named after one of the five recipients of the VCs awarded for bravery on a single day during the battle of Lone Pine in 1915:
- Burton’s Place – Alexander Stewart Burton
- Dunstan Grove – William Dunstan
- Tubb’s View – Frederick Harold Tubb
- Hamilton’s Corner – John Hamilton
- Shout Ridge – Alfred Shout
The estimated 700 residents, expected to occupy Crimson Hill eventually, comprise a mix of Defence personnel and civilians. There are many owner-occupiers and tenants.
DHA is an Australian government enterprise established by the Defence Housing Act 1987 to supply housing and related services to Australian Defence Force members, in-line with operational requirements. Launched in 1988 as a statutory authority, DHA is now a commercially-funded organisation that has projects all over Australia. During 2015–16, DHA managed 18,767 properties for ADF members and civilians.
Before construction commenced in 2013, the brownfield site had significant areas of native remnant bushland around the university campus. A detailed ecological assessment was done before any clearing started.
Indigenous seeds were collected from endemic species and these were replanted. It is estimated that over 90% of plants on the site now are native and the majority are locally occurring species.
The centrepiece of the estate is Charles Bean Sports Field, opened in December 2013. It was developed by DHA with Ku-ring-gai Council and the Northern Suburbs Football Association. The purpose-built, publicly-accessible sports field has received FIFA 2-star certification, the highest accreditation an artificial grass field can receive. There are football teams coming and going continually and it is rare to see the field without players on the evergreen surface.
Rainwater is harvested within the buildings for re-use and some have solar panels to reduce main-grid energy usage. Environmental consultancy Cundall, estimates the buildings will use 60% less energy and water than standard multi-residential developments. The residential development was designed by two architectural companies: Bates Smart and Architectus. Construction was by two building companies: Grindley and Ganellen.
The recently finished Shout Ridge is the first apartment building in Australia to receive a prestigious 6-Star Green Star – Multi Unit Residential Design V1 certified rating for environmentally sustainable design from the Green Building Council.
New School on the Horizon
The latest good news for Lindfield residents is that planning is underway for a major refurbishment of the empty UTS building that remains from its previous use as a university. The building is earmarked to become a new K to 12 school.
The large concrete building was handed over to the NSW Education Department as part of a land swap with UTS. Eventually 2,000 primary and secondary students are anticipated to attend the new school. It hopes to have high quality technical spaces for science, engineering, hospitality, visual and performing arts, as well as music and film. And there will be a childcare facility.
The former UTS building has architecturally heritage because it won the prestigious Sulman Medal for architecture in 1978. This is the highest award given in Australian architecture.
New Walking Track
NPWS and DHA, with the assistance of Friends of Lane Cove National Park, are building a new track from Crimson Hill to Lane Cove National Park. Locals will be able to walk along this bushland track and stroll among wonderful angophora, wattle and eucalypt trees to get down easily to Lane Cove National Park all without any need to get into a car. At a construction cost of more than $220,000, the track will be one more amenity for the residents of Crimson Hill and other locals.
Note: As it is, the track is not shown on our new map, Walking Tracks of the Lane Cove Valley. An example of how hard it is to keep up-to-date.
Lots More Development
As President of the Friends of Lane Cove National Park, Tony Butteriss points out in Regenavitis, wherever you look in Sydney now, there is more development and if feels as if it is getting closer to Lane Cove National Park. There are numerous projects coming right on the edge of the Park including the old UTS site, old Screen Australia site (adjacent) and redevelopment of the Acoustic Laboratory. However, the development that makes all the others look as if they are only playing, is the one at the Epping Road end of Delhi Road. Strictly speaking it is not one but at least three different developments planned to have a total of more than 2,200 units. This will have an impact of (at least) 5,000 people.
This particular development is a worry but consider the cumulative effect of all of them. Each development reduces habitat surrounding the Park. Each brings more hard surfaces and increases the speed of run-off after storms. And each brings visitor overcrowding to the Park. What can local groups do about this? The Friends hope to persuade the developers to fund some restoration projects.
The February edition of Regenavitis, the newsletter of the Friends of Lane Cove National Park, included the following update on the development of the former UTS (Ku-ring-gai) site in Lindfield that is now called Crimson Hill. We thank them for permission to reprint.
Click here for more information on the campaign.
Thirlmere Lakes and East Coast Lows
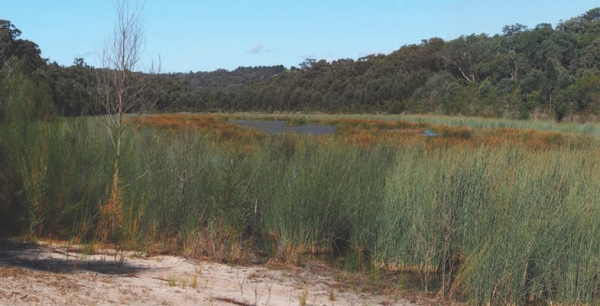
Thirlmere Lakes lie in an area that was subject tectonically to weak uplift and gentle monoclinal warping at the ill-defined southern end of the Lapstone Structural Complex, a feature that is highlighted further north by the bold escarpments of the Lapstone Monocline and the Kurrajong Fault. The chain of five shallow, swampy lakes lies in the remnants of an alluvium-filled, mature, incised-meandering river system that ancestrally drained westwards into the Wollondilly catchment. However, as a consequence of the gentle upwarping plus relative subsidence of the adjoining Cumberland Basin, the drainage direction in the north-east sector of the chain has been reversed due to headwater capture by Cedar Creek, which flows via Stonequarry Creek south-eastwards to the Nepean. The lakes are essentially stranded on a gentle watershed between two drainage systems.
The catchment area of the lakes is relatively small, roughly 10 km2 of Hawkesbury Sandstone spurs and side-valleys, and there is no long distance drainage flow-through along the dismembered ancient river course. But they overlie a substantial thickness of water-saturated alluvium whose water leaks away very slowly, and are in one sense the surface manifestation of its rising and falling water table.
Rises and Falls in Water Level
Latter day fluctuations in the water levels in these ancient lakes have been the subject of much recent debate centred around the possible effects on aquifers of longwall coal mining in nearby Tahmoor Colliery, operated by Xstrata. Other suggested factors have been the pumping of aquifers for local agricultural purposes.
Levels were particularly low in June 2010 (photo bottom left) and then rose quite slowly – below many people’s expectations (photo at the top of the page was taken in May 2015). However, the lakes now (March 2017) are as full as they’ve been in recent decades (photo bottom right).
You can easily access the rainfall data of the Bureau of Meteorology’s automatic rain gauge located near Buxton 3 km to the south, and from it you can deduce some interesting correlations.
The low water levels of 2010 following the exceptionally dry year of 2009 (photo bottom left) occurred when only 588 mm was recorded against a mean of 856 mm. In strong contrast, in 2017 (photo bottom right) is a hangover from the massive east coast low falls of June 2016 when 387 mm was recorded at Buxton, including a one day fall of 188 mm (contrast the wettest monthly total for 2009 of only 97 mm). Rains from east coast lows can overwhelm everything over huge areas, create massive floods, and fill and sometimes overflow our storage reservoirs. The plants don't need all that extra water, especially in winter, and what doesn't run off will bypass their root systems and swell the aquifers, including those that feed the lakes.
And what of the gradual rise in lake levels from 2010 onwards that had many people puzzled? Well, four out of the six years from 2010 to 2016 brought above average rainfall, peaking at 971 mm in 2013, and the other two were only slightly below – 736 mm in 2011 and 841 mm in 2014. The maximum one day fall in that period was 133 mm in January 2013 and January and February of that year scored a combined total of 326 mm. This was thus a slightly wetter than average time and the photo at the top of the page shows Lake Werri Berri recovering, roughly half full, in May 2015, a year in which the preceding month of April was the wettest one with a total of 164 mm.
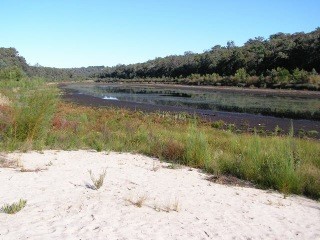
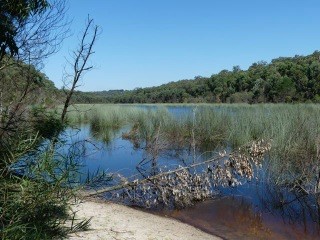
Are we still pointing a finger at Xstrata's longwall mine system? Well this is a personal opinion and don't quote me as an expert, but I believe it can only be a minor factor at most; rainfall versus evaporation is demonstrably the major control, as has been the case from historical records and one which is built into the conclusions of the report cited below. How climate change will affect things in the future is unknown, though there is already evidence of increasing intensity within rainfall events. More ones like June last year can only be good for the lakes.
Recommended reading: Thirlmere Lakes Inquiry Final Report of the Independent Committee, 23 October 2012
John Martyn recently visited Thirlmere Lakes to see how the area has fared during the recent period of freak weather. In STEP Matters 186 we wrote about concerns that the significant drop in water levels since the mid-1980s was due to longwall mining. It seems the picture has changed considerably.
Wianamatta Group
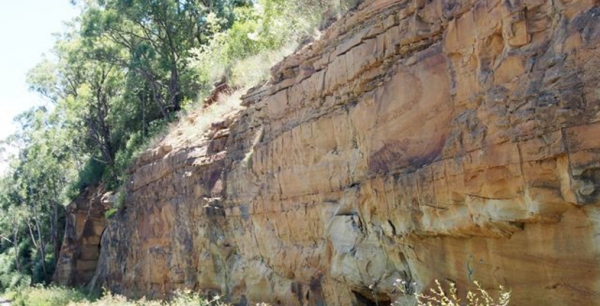
The name Wianamatta is familiar through the loose usage of the term ‘Wianamatta Shale’ to embrace the Triassic rocks that overlie the Hawkesbury Sandstone. This is an informal term, distinctly woolly in its definition, and should be avoided, but if it must be used, ‘shale’ or ‘shales’ should always be spelt lower-case.
Wianamatta Group, derived from the Aboriginal name for South Creek, was established formally in 1952, fully documented in 1954 and further revised in 1979. The group consists of three formations: the Ashfield Shale, Minchinbury Sandstone and Bringelly Shale. It occupies the centre of the Sydney Basin, lapping onto the lower Blue Mountains and extending southwards to the Southern Highlands. It has been defined largely from drillhole data because outcrop is mostly limited to road and railway cuttings and quarries.
The thickest stratigraphic section drilled was encountered in hole DM Razorback DH1 on
Mt Hercules near Picton. This passed through 304 m of Wianamatta Group strata consisting of 257 m of Bringelly Shale, 2 m of Minchinbury Sandstone and 45 m of Ashfield Shale.
The Ashfield Shale and Minchinbury Sandstone correlate well across much of the 50 km long area covered by the same Department of Mineral Resources drill program, whereas the Bringelly Shale is much less uniform, its variability enhanced by the presence of many scattered sandstone lenses of limited lateral extent but up to more than 40 m in thickness that are hard to correlate.
The Wianamatta Group was deposited on a coastal lowland subject to early minor marine incursions. The depositional environment evolved upwards into lagoonal or marshy lowland crossed by meandering rivers that brought surges of sand that filled channels and created the sandstone lenses.
Ashfield Shale
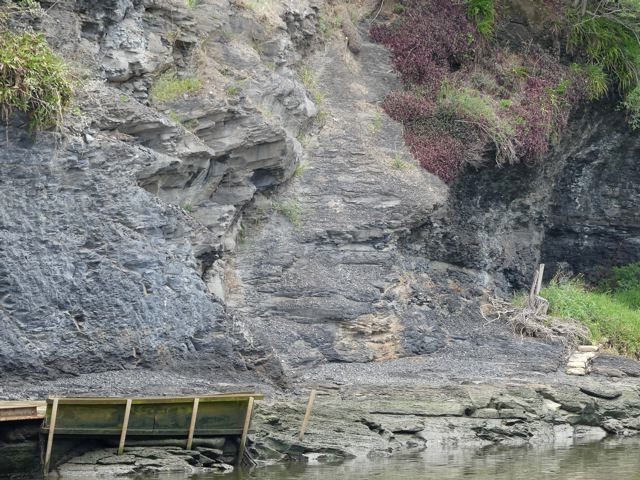
The Ashfield Shale has a maximum drilled thickness of 61.6 m at Erskine Park near the centre of the basin and has been subdivided into four members consisting of alternating layers of dark ferruginous shale and laminite.
All of these members were once incompletely exposed in the Thornleigh brick pit but this has since been filled in. Now, the most viewable Ashfield Shale faces can be found along the North Shore and Northern railway lines and Bells Line of Road, and in a number of other road cutting exposures such as Horace Street, St Ives and in the Picton–Campbelltown area.
The best natural exposure is the river-cliff in Mulgoa Nature Reserve south of Penrith which exhibits dark coloured Mulgoa Laminite Member, and also the river-cliff opposite the Parramatta ferry wharf (see photo). The Mulgoa cliff is visible from Mulgoa Road through gaps in a screen of riparian forest but is difficult to access on foot.
An important feature of the Ashfield Shale is its relatively high phosphorus content of between 0.1 and 0.9% P2O5. This is in strong contrast to the negligible amounts of phosphorus in the underlying Hawkesbury Sandstone and is also significantly higher than levels in the Bringelly Shale. Phosphorus values in Ashfield Shale measured from drill core tend to be spiky with prominent peaks, and it appears the element resides in thin beds rich in phosphatic siderite nodules.
Minchinbury Sandstone
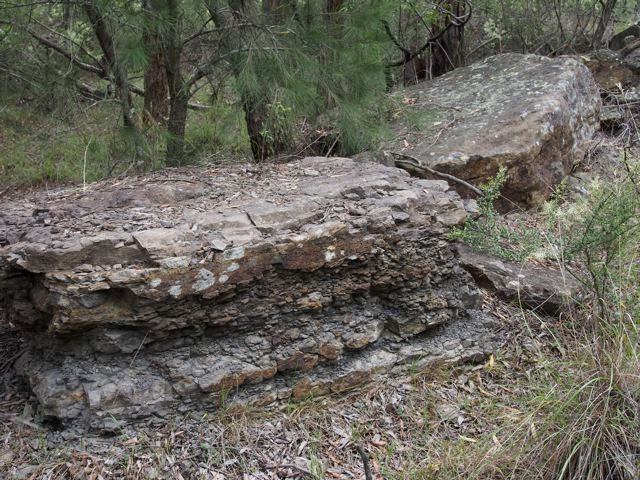
The Minchinbury Sandstone is a widespread but thin (less than 6 m) marker band of fine-grained, bluish-grey, brown-weathering rock that is rarely seen in surface outcrop and is known mainly from drill intersections. It is a quartz lithic sandstone with grains mostly of quartz with about 10% of rock grains. It also contains calcite, plus micas, notably muscovite which can be seen sparkling on broken surfaces. Another very similar, intermittent sandstone bed lies immediately above in the lower Bringelly Shale. Both sandstones weather deeply to a crumbly or flaky condition and surface expressions are subtle, or the sandstone outcrops are smoothed over by soil profiles or pasture.
Minchinbury Sandstone at Minchinbury is more than 100 m deep in a borehole, and finding its outcrops elsewhere, especially natural ones, is a challenge. Near the top of the Mulgoa shale cliff there is a thin (less than 1 m) band of very fine-grained flaggy sandstone which has been interpreted as Minchinbury. In Lansdowne Park (see photo) there is a train of large, disjointed sandstone slabs whilst other small outcrops and floaters are scattered along a low, hillside bench. There are a few others, but if you happen to know of any more, please let me know.
Bringelly Shale
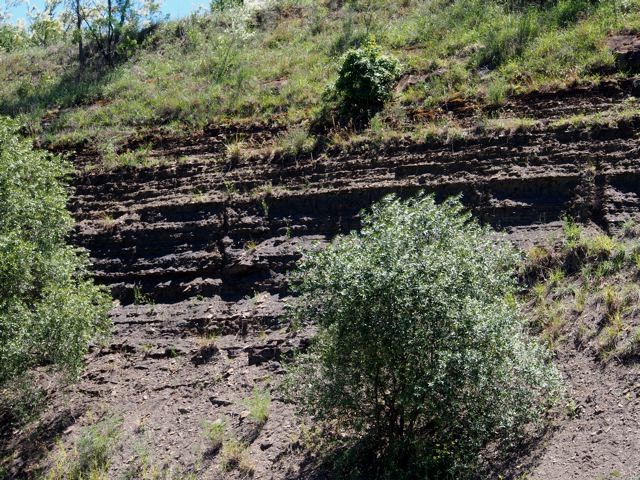
The Bringelly Shale is the uppermost formation of the Wianamatta Group and also the youngest Triassic sedimentary unit in the Sydney Basin. Reaching more than 250 m in the south, it is also one of the thickest.
The commonest rock type exposed is a mixture of finely-bedded shale, laminite and siltstone. Seen in road cuttings this differs from the dark, almost black, clay-mineral-rich Ashfield Shale, being more variable, often accompanied by disconnected sandstone lenses that become thicker and more prominent from Western Sydney Regional Park southwards, forming most of the hilly country between Campbelltown and Picton. Driving south or into the Picton area you can't miss them. They form intricate escarpments up to 200 m high, and the sandstone cliffs along the old Hume Highway near Picton (see photo) are of the two thickest ones, the Mt Hercules and Razorback Sandstone Members (see photo at the top of the page).
Such sandstones have been described as lenses and stacked multiple lenses and have been interpreted as infill deposits in channels created by rivers meandering across the swampy lowland. Their lateral extent is not great and they are difficult or impossible to correlate with one another across distances of more than a few kilometres, but they are important in defining the landscape, their scarps and hollows nurturing sub-types of endangered Cumberland Plain Woodland floras.
Ashfield Shale Floras
Ashfield Shale outcrop extends to higher elevations and into higher rainfall areas than Bringelly Shale. These include the North Shore where rainfall zones exceeding 1000 mm, and similarly the Bilpin–Mountain Lagoon area. Where the shale forms cappings that fringe the Illawarra escarpment the mean annual falls may exceed 1500 mm by a significant amount.
Blue Gum High Forest is familiar to most STEP members and needs little description here. Most members live within 10 min drive of Dalrymple-Hay and Sheldon Forest or can easily reach more far flung localities like the Blackbutt forest of Galaringi Reserve or the Blue Gum, Grey Ironbark forests of Rapanea Community Forest, both in the Carlingford area. But even more diverse treats are in store in the Blue Mountains where the Mountain Blue Gums Eucalyptus deanei and Monkey Gums E. cypellocarpa grow tall and stately in the endangered Blue Mountains Shale Cap Forest of the Bilpin area. These two are members of a cornucopia of eucalypt species as the community grades laterally into Sydney Turpentine Ironbark Forest and Shale Sandstone Transition Forest. Appearing are Grey Ironbark, Mountain Mahogany E. notabilis, Grey Gum, White Stringybark, Sydney Peppermint, and of course not forgetting Turpentine.
Have you visited the Illawarra Fly Treetop Walk at Knights Hill near Robertson? If not it's worth an outing, rounded off by a pie at the Robertson Pie Shop. The walk meanders through the crowns of two tall eucalypt forest species,
Gully Gum Eucalyptus smithii and Brown Barrel E. fastigata. Ashfield Shale sits atop a sheer cliff of Hawkesbury Sandstone protected by a large capping of Cenozoic basalt. The weather station at the pie shop records a mean annual rainfall of nearly 1600 mm.
Scheyville National Park near Pitt Town is perhaps the best place to look at lower rainfall communities on Ashfield Shale. It includes part of the former Pitt Town Common grazing lands whose pasture merges into tracts of quite dense woodland and forest. The dominant plant community is the critically endangered Cumberland Plain Woodland whose principal tree species are Grey Box Eucalyptus moluccana, Forest Red Gum E. tereticornis and Narrow-leaved Ironbark E. crebra. The forest floor is often grassy and may be sprinkled with quite delicate wildflowers like Blue Trumpet Brunoniella australis in spring and summer. Cumberland Plain flora shares many herb and shrub species with the tablelands and slopes of NSW but in the grassy ground flora you'll also be reminded of aspects of Blue Gum High Forest.
Bringelly Shale Floras
The Minchinbury Sandstone is so thin and it weathers so readily that, vegetation-wise, it is inseparable from the Bringelly Shale (or for that matter the underlying Ashfield Shale).
The Bringelly Shale supports a more varied range of Cumberland Plain plant communities than the Ashfield Shale described earlier. Because of the presence of sandstone beds and lenses, its country can be quite hilly, with sheltered slopes and valleys, and this has led to the creation of Shale Hills as distinct from Shale Plains woodlands as Cumberland Plain Woodland subtypes. Sheltered valleys and steep slopes have also nurtured additional communities such as Western Sydney Dry Rainforest and Moist Shale Woodland, both also listed endangered. However, rainfall nowhere reaches levels that would support tall blue gum forests like those on Ashfield Shale in Sydney’s upper North Shore or the lower Blue Mountains.
Reserves carrying native vegetation on Bringelly Shale are relatively small, widely scattered and often subject to weed invasion especially by African Olive, Lantana, privet species and African Lovegrass. They include Lansdowne Park, remnant pockets within Mt Annan Botanic Gardens, Mulgoa Nature Reserve, Shanes Park, and Wianamatta and Western Sydney Regional Parks including Kemps Creek.
In Western Sydney Regional Park you can wander from the main park areas into quite dense Spotted Gum forest, and into sheltered niches below escarpments formed by sandstone lenses which carry Moist Shale Woodland and Western Sydney Dry Rainforest, with odd ring-ins like White Mahogany Eucalyptus acmenoides amongst the Spotted Gums and Forest Red Gums. Understory species include Mock Olive Notelaea longifolia and Hairy Clerodendrum Clerodendrum tomentosum. Climbing plants are particularly diverse and include native Grape Cayratia clematidea and Gum Vine Aphanopetalum resinosum (from personal experience, too aggressive to grow in the garden).
Main reference: Herbert, C. (1979) The Geology and Resource Potential of the Wianamatta Group, Geological Survey of NSW Bulletin 25
This is the fourth in a series of articles by John Martyn on Sydney’s geology.
AABR Pioneers
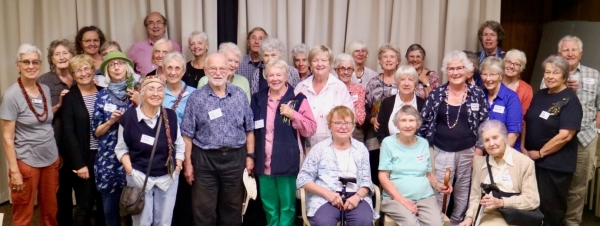
The Australian Association of Bush Regenerators was established in 1986 out of concern for the continuing survival and integrity of bushland and its dependent fauna.
The AABR recently put on a lunch for what they called the pioneers of bush regeneration, those visionary and committed people who took the concept from the Bradley sisters, developed it, sat on committees, turned it into a tech course, wrote text books and generally created a new approach to bushland management. Apart of course from working in the bush themselves.
Ten Years of Blue Gum High Forest Protection
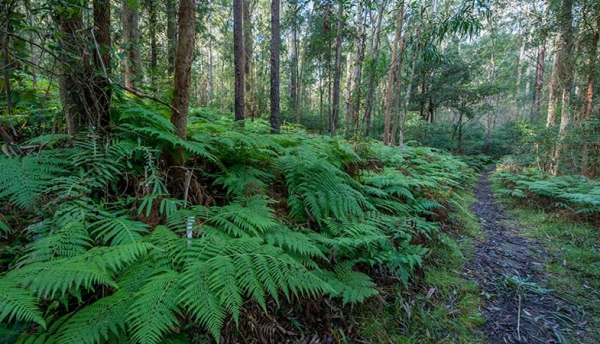
Sydney's Blue Gum High Forests built colonial Sydney. By the 1850s most had gone. However a few patches survived. The largest one was in St Ives. It was so rare, that Richard Dalrymple-Hay, NSW’s first Commissioner of Forests, acquired it as a demonstration forest. This became known as the Dalrymple-Hay Nature Reserve.
In 1934 Annie Wyatt – later to become the founder of the National Trust – led a community campaign to save this endangered forest.
Then again in 2007, the community led another campaign to acquire two privately owned blocks of land into public ownership and so protect the forest. To celebrate the tenth anniversary of this campaign, Friends of Ku-ring-gai Environment (FOKE) and STEP have organised some walks which highlight the beauty of Blue Gum High Forest and Janine Kitson is presenting a talk entitled The Battle of the Blue Gums.
FOKE Walk on Sunday 7 May – Dalrymple-Hay Nature Reserve
Time: 9:45 for a 10 am start (finish noon)
Meet: entrance to Dalrymple-Hay Nature Reserve (cnr Rosedale Road and Vista Street, St Ives)
Book: Janine Kitson (0428 860 623, 9498 2402, This email address is being protected from spambots. You need JavaScript enabled to view it.)
Nancy Pallin, one of the leaders of the campaign, will lead a walk demonstrating the unique features of this outstanding forest.
FOKE Walk on Sunday 14 May – Sheldon Forest from Turramurra to Pymble
Time: 9:45 for a 10 am start (finish noon)
Meet: ticket office, Turramurra Station
Bring: hat, water, snack and good walking shoes (involves walking up some steep hills)
Book: Janine Kitson (0428 860 623, 9498 2402, This email address is being protected from spambots. You need JavaScript enabled to view it.)
Sheldon Forest is one of Sydney’s rarest urban forests. It is within walking distance of not one, but two, railway stations – Turramurra and Pymble. The North Shore railway line forms a wildlife corridor that connects Sheldon Forest to other remnant forests in reserves and gardens. This ecologically focused heritage walk explores the unique relationship between the natural and built heritage of Ku-ring-gai and Sydney's forest history. It reveals layers of history – indigenous, colonial, federation, interwar, as well as revealing Australia’s rich biodiverse natural history. Discover why the resilience and protection of this magnificent Blue Gum High Forest is so important during a time of climate disruption and biodiversity extinction.
NPA Talk on Saturday 10 June – The Battle of the Blue Gums
Time: 10 to noon
Tutor: Janine Kitson
Book: https://www.weasydney.com.au/course/TBBG
During the 1930s, two forests were under threat – the Blue Gum Forest in the Blue Mountains and the Blue Gum High Forest in suburban Sydney. Discover how pioneer conservationists like Myles Dunphy and Annie Wyatt successfully rallied to protect these forests. How did these forest battles contribute to the modern Australian conservation movement? How are these forests faring today – at a time of burgeoning population increase, habitat loss and climate change?
STEP Walk on Sunday 18 June – Blue Gum Walk in Hornsby Valley
Why Give the Green Army its Marching Orders?
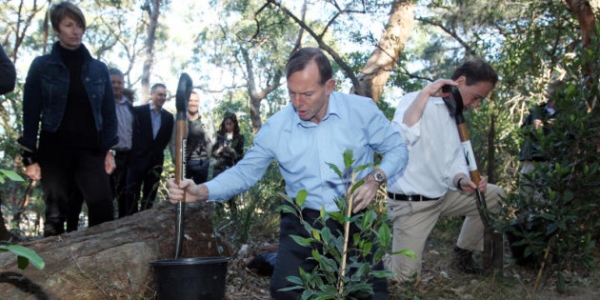
It’s a rare week when natural resource management policy penetrates the national news cycle not once, but twice.
Nonetheless, last Thursday the federal government struck a deal with the Greens to increase funding to Landcare programs by $100 million in exchange for their support on other matters. No one quite seems to know yet how this money will be spent – presumably in ways that support the thousands of volunteer community Landcare groups dotted around Australia.
Then on Sunday, the Australian Financial Review reported that the government will abolish the Green Army program as part of its mid-year budget update later this month.
Introduced in 2014 as a signature policy under the then prime minister, Tony Abbott, the Green Army aimed to mobilise 15,000 young and unemployed people to work on conservation projects and receive complementary training. Axing the program would deliver budget savings of around $350 million.
Abbott took to Facebook on Monday to criticise the move. His main concern seems to be the implication that the Greens’ policy priorities are more important than the Coalition’s. That’s a bad look, he argues, for a 'centre-right government'.
Yet the move would arguably be very much in keeping with centre-right values. By reinvigorating Landcare’s model of personal responsibility and self-regulation, the government could reduce pressure to regulate land use or to pay landholders financial incentives to improve their environmental management.
But consistency with any particular political philosophy is not the issue here. The hyper-polarised political landscape of recent years, particularly on environmental policies, encourages parties to differentiate on any grounds they can. Thus, the cross-party support long enjoyed by Landcare can perversely work against it. Incoming governments believe they need new programs to claim as their own, diverting attention and resources from those already in place.
The $484 million cut to Landcare in the 2014 budget needs to be remembered in this context. Both Coalition and Labor governments have made changes over the years that either reduced the financial support available to community Landcare groups, or imposed more top-down modes of decision-making.
The 2015 Senate inquiry into the National Landcare Program revealed considerable community concern about the impacts of budget cuts on Landcare’s activities and on private commitment to natural resource management. Every dollar of public money invested in Landcare is believed to leverage between $2.60 and $12.00 of community and landholder investment.
When the Green Army was launched, many people questioned whether it would deliver this kind of value for money. With a three-year review of the Green Army due for release early next year (subject to ministerial approval), we might have expected to see some answers.
So why is the Green Army is being cut before the review? Perhaps the government is sparing itself the embarrassment of defending a program that is failing to meet its objectives. Perhaps, despite the critics, the findings would have been positive and the government is avoiding having to explain why the Green Army is being killed off anyway. Perhaps it’s just looking for easy budget savings.
Strategic plan?
Whatever the motivation, the biggest concern is the absence of a strategic and coherent approach to natural resource management policy in Australia. Major program changes are being made with limited consultation and transparency, and precious little evidence of planning.
At the same time, some policies and programs appear to be working at cross purposes. For example, tree clearing is increasing in much of Australia at the same time that some landholders are being paid through the Emissions Reduction Fund to conserve native vegetation.
Questions need to be asked about the genuine impacts of existing policy, about the way in which regulations intersect with voluntary programs, and about coordination between Commonwealth and state governments, among other issues.
The recent Senate inquiry into Landcare called for long-term investment and stability in natural resource management programs. Achieving this will require a return to genuine cross-party support coupled with broader community and industry support. The key to achieving this, I suspect, is less wheeling and dealing among political parties and more consultation and planning with all interested stakeholders.
It might be time to consider a white paper process to inform the next phase of natural resource management policy. At least that would give us some confidence policy is not being decided on the run.
Stewart Lockie, Director, The Cairns Institute, James Cook University
This article was originally published on The Conversation. Read the original article.
Australia Day Award for Helen Wortham

STEP is delighted that our secretary has received Ku-ring-gai Council’s Australia Day Award for Outstanding Service to the Ku-ring-gai Community (Individual).
Helen has been the key engine-room of STEP as a committee member since 1990 and secretary since 1997. She has devoted many hours applying her comprehensive skills to the operation of STEP. Her work has included maintaining the membership records, creating communication material, editing our newsletter and publications, promoting and selling our books and maps. More recently she has been the brains behind the modernisation of our website and the transformation of our newsletter distribution into the digital age.
Without Helen’s selfless devotion STEP could not have functioned successfully.
Sandstone-Shale Transition – the Mittagong Formation
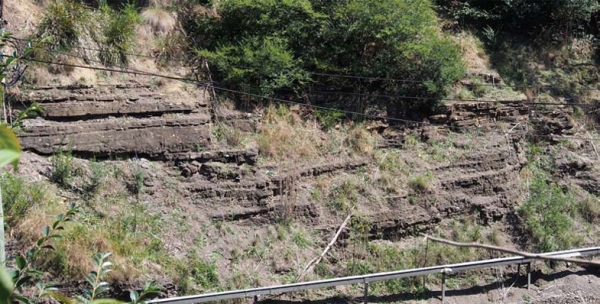
The geology of the Sydney Basin changes dramatically at the top of the Hawkesbury Sandstone, which is followed upwards ultimately by the thick, shale-dominated Wianamatta Group. It isn’t an abrupt change but usually a transition, via several metres of alternating sandstones and shales called the Mittagong Formation. The quartz-rich sandstones of the Mittagong resemble finer-grained versions of the Hawkesbury Sandstone and they are interleaved with dark grey to black shales, siltstones and laminites.
Originally named Passage Beds by JF Lovering in 1954, the current name was adopted from a selected type locality, the Gib (Mt Gibraltar) railway tunnel at Mittagong, where the formation is 15 m thick. Elsewhere it is almost invariably less than 10 m and can locally be absent altogether. Exploratory drilling for the Epping to Chatswood railway tunnel at Macquarie Park, for example, encountered only a 2 to 5 m thickness of it.
The variability is in part due to the nature of the dwindling flood plain and braided river system which deposited the Hawkesbury Sandstone. This vast system eventually lost its strength and became a plain of scattered sandbanks, swamps and lagoons. Clays settled in the latter but were periodically overwhelmed by sand brought by late floods leading to a sandstone/shale alternation of very variable thickness.
For such a thin unit the Mittagong Formation has a disproportionate effect on vegetation because it usually creates a broad bench at the top of the Hawkesbury Sandstone’s steep rocky dropoffs and cliff lines. This leads to the retention of soils and can even collect downwash from overlying Ashfield Shale if present. Such level surfaces can also attract deep weathering and laterite formation.
Like the shale lenses in the Hawkesbury, Mittagong Formation forms richer soils than the sandstone but stonier, more lateritic and less fertile than those of the overlying Ashfield Shale. These yellowish soils are typically classified as belonging to the Lucas Heights soil landscape, highlighting similarities in the bedrock between Mittagong Formation and Hawkesbury Sandstone with its shale lenses in the Lucas Heights area.
Plant communities hosted by Mittagong Formation are diverse and usually gradational to those of adjoining shale or sandstone, often falling within the broad envelope of Shale Sandstone Transition Forest with either a sandstone bias or a shale leaning depending on setting. In other sites the communities may be more tightly defined in terms such as Sydney Turpentine Ironbark Forest, Turpentine Ironbark Forest, or where strongly lateritised, Duffys Forest. They tend to have one thing in common, they are mostly legally defined as threatened, mainly because they survive in narrow, disjointed enclaves isolated by land clearing.
Is it Possible to View the Mittagong Formation?
Not as easily as you might think, and only in artificial cuttings – natural exposures are virtually unknown!
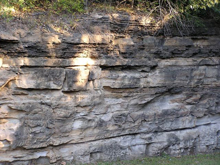 You can look at its type locality at the south-west end of the Gib Tunnel at Mittagong but only by telephoto lens through a security fence (see photo at the top of this page). It's also visible in cuttings along the M31 nearby, but at 110 km/h it's a case of ‘don't blink or you'll miss it’. The best locality is probably the road cutting of the Picton railway overbridge (see photo) though you'll have to park down the road and walk back in if you want to see it hands on.
In our own local area there are a number of rather poor and vulnerable artificial exposures, like the M2 cutting under the Barclay Road over-bridge at North Rocks. But this is currently being plastered in concrete by the North Connex guys and will soon largely disappear. The embankment of the Abbott Road eastbound feed-in lane to the M2 is good too but you can't stop there, nor can you for the south-west embankment of the M2 north-west of the Lane Cove Road interchange at Macquarie Park.
As for natural outcrops, when you stroll around in bushland on the flat ground above Hawkesbury Sandstone dropoffs you may see abundant shards of lateritised shale and siltstone in the soil, but unless you stumble on an erosion gully or creek line you'll be lucky to see anything more.
Sheldon Forest
Sheldon Forest is a pretty good start. Wander down past the scout hall to the sweeping apron of tall Blackbutt forest and you'll be descending from Ashfield Shale onto Mittagong Formation. As the track descends further towards the Hawkesbury Sandstone dropoff there is a marked increase in Turpentines, Sydney Red Gums and many shrubs of sandstone affinity such as banksias. But you don't have to return very far back uphill before shale species like the pea-flowered groundcover Tick Trefoils Desmodium rhytidophyllum and D. varians reappear.
Auluba Reserve
At roughly 3.5 ha, this is probably the largest area of Mittagong Formation bushland in the Lane Cove catchment. It's primarily Blackbutt forest very like lower Sheldon but several other tree species are present, notably Sydney Red Gum, Red Bloodwood and Red Mahogany, and both White and Narrow-leaved Stringybarks are present though these are rare, scattered and sometimes in poor condition. The shrub flora is rich and includes the critically endangered Julian's Hibbertia, H. spanantha. The Sydney region has a greater diversity of hibbertias than any other similar-sized region of Australia and H. spanantha will very likely not be the last new species to be discovered.
North Epping Oval Bushland
This sits above the sandstone on the opposite side of the Lane Cove Valley across from South Turramurra. It's a small area with a very diverse tree community, including Sydney Red Gum, Red Bloodwood, Narrow-leaved Stringybark, Sydney Peppermint, Blackbutt, Turpentine and Christmas Bush. The shrub Laurel Geebung Persoonia laurina, uncommon in the Lane Cove catchment, is quite common here.
Fred Cateson Reserve, Castle Hill
Located at the junction of Showground Road and Gilbert Road, this is a classic locality to walk from shale cap down across the Mittagong Formation and see key plant species. The lower parts of the reserve are Hawkesbury Sandstone but the crest of the rise bordering Gilbert Road carries shale and transitional flora, notably with trees like Grey Gum, White and Thin-leaved Stringybarks, Grey, Broad-leaved and Narrow-leaved Ironbarks, Red Mahoganies and Forest Red Gums. As you descend towards the sandstone, Red Bloodwoods and Black She-oaks assert their presence.
Fagan Park – Carrs Bush, Galston
A stones throw north of Galston, this popular area of grassy park, lakes and bushland straddles the sandstone–shale transition zone, though how much is Mittagong Formation and how much Ashfield Shale is hard to deduce on the ground. The bushland fringe along Arcadia Road is certainly on shale and you can find good specimens of White Stringybark, White Mahogany and Grey Ironbark. This changes north-eastwards, and if you enter the park from Carrs Road you will first see the odd White Mahogany and Grey ironbark but you will immediately enter an area of pure Turpentine forest, almost certainly hosted by Mittagong Formation soils.
This is the third in a series of articles by John Martyn on Sydney’s geology.
Have Your Say on Hornsby Quarry Development
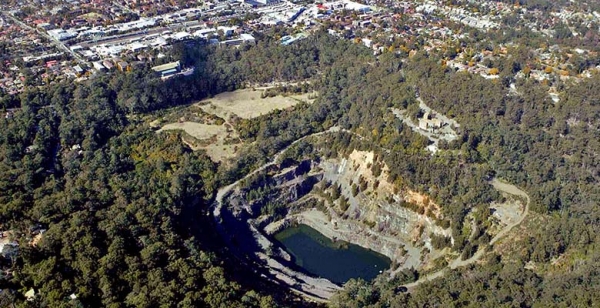
Hornsby Council has moved to the next stage of planning for the redevelopment of Old Mans Valley and the Quarry. There is an opportunity for you to make suggestions about how the area should be developed and used.
South Dural Development Stopped … For Now
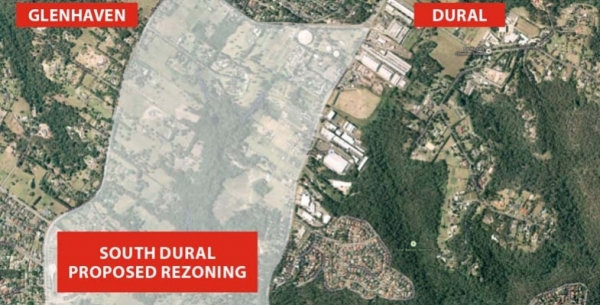
We've previously summarised our concerns about the application to rezone rural land to residential land. It is a relief that Hornsby Council has decided to discontinue evaluation of the proposal. But this is only until an infrastructure and funding plan is in place for this and other developments in this rural area.
Over 5,000 submissions were made opposing the development, many for reasons other than congestion along New Line Road and lack of other infrastructure. There will be more opposition to come when the developer has another go. With any luck the proposal will be deemed inconsistent with the North District Plan that aims to retain rural land.
Greater Sydney Strategy
It's important that as many people as possible comment on the Greater Sydney Strategy and the North District Plan by 31 March 2017.
Towards Our Greater Sydney 2056 is a 40 year vision that spells out the anticipated rate of growth and framework for employment and population distribution. How this is done will ultimately determine the long-term impacts on our natural areas, STEP’s chief focus.
For a city the size of Sydney, strategic planning over a 40 year period is important. However as outlined below there are matters of serious concern.
High Rate of Growth
On p8 there is this statement:
Greater Sydney is experiencing a step change in its growth with natural increases (that is an increase in the number of births) a major contributor. We need to recognise that the current and significant levels of growth, and the forecast higher rates of growth are the new norm rather than a one-off peak or boom.
Given the clear impacts of high growth rates on our urban amenity this statement needs closer scrutiny.
Refer to the table below for the projected growth rates and the figure below for the net overseas migration component.
| Region | Population 2011 | Projected population | ||
| 2036 | Change 2011–36 | % change 2011–36 | ||
| Greater Sydney | 4,286,350 | 6,421,950 | 2,135,650 | 49.8% |
| Rest of NSW | 2,932,200 | 3,503,600 | 571,400 | 19.5% |
From the figures the total projected increase in population in NSW from 2011–36 is around 2.7 million. Of this, for the same period, the total from net overseas migration is around 1.7 million, leaving the natural growth at around 1 million.
A recent report by the Planning Institute of Australia on population trends, Through the Lens: Megatrends Shaping our Future (p12) concluded:
Overseas migration continues to be the biggest contributor to population growth.
Net overseas migration for Australia since 1976 is shown in the lower figure. On p12 it says that:
Of the three basic factors determining population growth (fertility/births, mortality/deaths and migration) the net migration rate is most subject to policy intervention, and thus the most uncertain in future projections.
Since the net migration rate is the primary determinant of Australia’s population growth and is controlled by government policy, it is clearly possible to regulate the overall population growth rates of Australia to ensure they are at acceptable levels and anticipated benefits are broadly realised.
The regulation of inflation by the Reserve Bank has proved beneficial relative to an unregulated economy. Regulation of Australia’s overall population level and age structure through adjustment of net migration targets by a Federal government agency could prove beneficial to planning within Australia. This agency has to work in concert with state governments that bear the brunt of the implementation consequences.
High growth rates are resource intensive, difficult to manage and can lead to significant long-term environmental impacts. In the past these have included a higher proportion of defective buildings, lags in required new infrastructure with traffic congestion increasing and damage to bushland and watercourses from greater urban stormwater run-off.
The current proposed annual growth rates of around 1.6% are too high and need to be reduced to the more manageable levels in the previous three decades of around 1%. The Mercer World’s Most Liveable Cities ranking indicates that beyond a population of around 6 million liveability declines. Sydney has to recognise that growth cannot be infinite and ultimately must plan for a zero net growth future.
The Greater Sydney Commission may not have a say in the growth projections but we think people should be able to express their views through the current consultations process and local federal and state MPs.
Urban Renewal
On p8 it states that the shorter term need for additional new housing capacity is greatest in the North and Central Districts. While this will lead to more high-rise development along the railway line it is important that urban conservation corridors are retained.
For example it is possible to walk from Gordon, Killara and Roseville Stations through high quality urban conservation areas to the bushland that leads to Garigal National Park. The value of these conservation corridor links from railway stations to our national parks can only increase with time.
Medium Density Infill Development
On p9 it states:
Many parts of suburban Greater Sydney that are not within walking distance of regional transport (rail, light rail and regional bus routes) contain older housing stock. These areas present local opportunities to renew older housing with medium density housing. Medium density housing is ideally located in transition areas between urban renewal precincts and existing suburbs, particularly around local centres and within the 1 to 5 km catchment of regional transport.
A 1 to 5 km catchment from the railway stations and regional bus routes would include virtually all of the North Shore. Future medium density in these areas is likely to be fast-tracked by developers using the NSW government’s proposed Complying Medium Density Housing Code (CMDHC).
Provided prescribed standards are met this could allow building density increases by as much as a factor of two without the need for consent. Because of its indiscriminate nature, for those areas impacted by the code, it could lead to increases in dwelling numbers significantly in excess of those planned for.
The CMDHC is proposed in extensive single dwelling R2 zones for those councils where multi-dwelling housing or dual occupancy is permissible in this zone. If one council allows multiple dwellings it will flow through to all the original member councils when they amalgamate.
Examination of the relevant LEPs indicates all the amalgamated councils in the North District will be impacted with the exception of Hornsby–Ku-ring-gai. STEP strongly opposes application of CDMH in any residential zone other than the medium density R3 zone.
Economic Priorities
On p7 there is a focus on the economic growth from inbound tourism. This would be a serious concern if our bushland and national parks are treated as assets for commercialisation. Sensitive natural bushland areas can easily be damaged from overuse and need protection. Private leasehold of areas with existing bushland and clearance for accommodation should not be supported.
Let’s Keep Turramurra Village Park

Ku-ring-gai Council has been developing plans to improve the Turramurra local centre over many years. As a resident of Turramurra for most of my life I can attest that the town centre has hardly changed in over 50 years.
Turramurra has the perpetual problem of being split into three sections by the railway line and Pacific Highway. There is no coherent centre for the community, just strips of shops, a couple of supermarkets and three car parks.
There is a small triangular park, called the Little Village Park, bordered by railway land, Pacific Highway and William Street. It is shaded by large trees that are mostly on railway land. Many of the trees are deciduous so the grass doesn’t grow very well because of the shade but it is very pleasant in all seasons. However there is little vegetation along Pacific Highway so traffic noise and pollution are not buffered. The land slopes away down to the exit from the station. There are a couple of seats but no other facilities.
The park has great potential to be a community space but council claims that it is under-utilised. Could that be because there is little amenity in its current state?
Council has developed a plan ‘to activate’ the Coles supermarket side to the west of the railway line, to be called the Turramurra Community Hub. Little Village Park was not included in the plan originally apart from funding being provided for an upgrade. (No one knows what will happen on the other side of the railway line. Woolworths did put up a proposal leading from the old post office site that remains derelict.)
However last year council proposed to add Little Village Park to the development plan by changing its current zoning as a public park (RE1) to be part of main B2 (local centre) zoning so the park could be developed as part of the Community Hub. The documents suggested a three-storey community centre be built on the land.
There was such an outcry that council held a public hearing. The independent chair recommended that the rezoning not proceed. Despite this, council staff still recommended that the rezoning could proceed and council voted 5 to 4 accordingly on 7 February.
Integration with the Rest of Turramurra
The park could possibly be integrated with development on the other side of the railway line and create a more coherent suburb. The station access bridge has been widened recently so could it be widened even more? But I am not an architect. This will not be possible once there is a large building butting alongside the avenue of trees along the railway line. This is an area with tall trees and the potential for further deep root planting.
The plans for the overall Community Hub development seem to include only concrete plazas with small trees competing with the reflective glare from all the apartment and commercial buildings. Little Village Park could remain an attractive oasis with picnic tables and a shady playground.
Is Australia Winning? (Postscript)

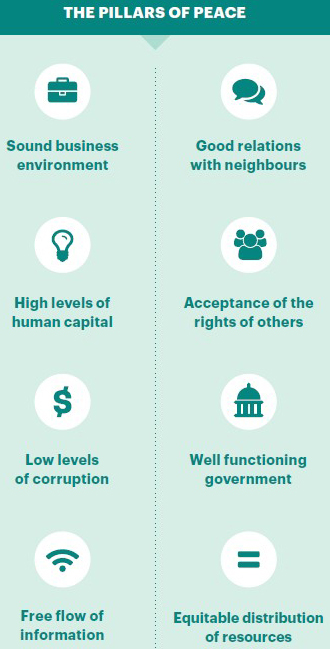 The Institute for Economics and Peace has supplemented their Global Peace Index with a Positive Peace Report 2016. But be warned, at 94 pages, it’s not a light read.
The framework used to measure positive peace is based on eight factors (pillars of peace) which are shown right, with a scoring system based on the winner having a low positive peace index (PPI) of near one (1) with others being higher.
Here are the top 15 countries in the PPI:
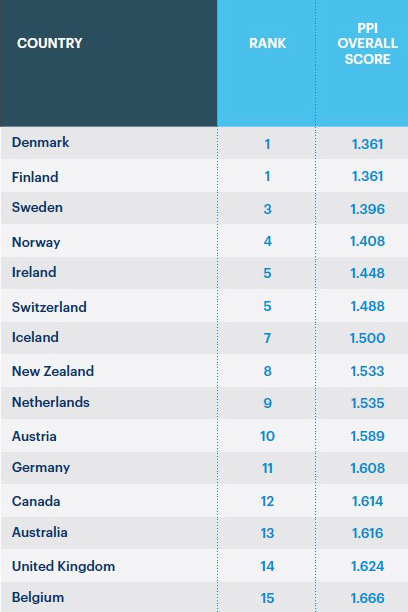
Given that the bottom countries have a PPI score greater than four, Australia’s 1.616 isn’t really too far behind the winner’s 1.361.
It’s worth looking at the winners by pillar:
| Pillar | Winner | Runnerup | Australia’s place |
| Well functioning government | Denmark | Finland | 6th |
| Low levels of curruption | New Zealand | Denmark | 7th |
| Sound business environment | Singapore | New Zealand | 3rd |
| Equitable distribution of resources | Sweden | Israel | 10th |
| Acceptance of the right of others | Sweden | Iceland | 8th |
| Free flow of information | Finland | Estonia | 19th |
| High level of human capital | United Kingdom | Ireland | 17th |
| Good relations with neighbours | Ireland | Austria | 64th |
Much as we might be discomforted by our placing in Information and Human Capital what a shocker that we could be 64th on neighbourliness.
Before we get too excited note that New Zealand is 54th which isn’t too far off our score. Does New Zealand have neighbours? One supposes so but they are all some distance away.
Page 41 documents the basis of the pillar Good Relations with Neighbours:
- hostility to foreigners- measures social attitudes toward foreigners and private property
- number of visitors- as per cent of the domestic population
- regional integration- measures the extent of a nation’s trade-based integration with other states
Number of vistors must be grossly unfair to both Australia and New Zealand because of the distance from other countries. Austria, which ranks second for neighbourliness, gets 25 million tourist arrivals a year or about 3.0 per head of population; Australia gets 7 million (less than 0.3 per head of population) source http://data.worldbank.org/indicator/ST.INT.ARVL.
One wonders if the Institute for Economics and Peace adjusts for length of stay by tourists. No one comes to our part of the world for a day or two whereas day visitors to Austria from border countries would be a significant proportion of the total.
The last item – trade integration – also raises queries. For starters is it really a matter for a ‘peace’ index? A country that promotes autarky (self-sufficiency, minimise imports) can still have peaceful relationships with neighbours even if some might be frustrated at the lack of export opportunities.
It’s a moot point whether trade data should be adjusted for the import component of exports, ie the exports have low value added if the import component is high.
Ireland ranks first under this pillar. It maybe that the main factor contributing to this is the high proportion of exports to GDP (about 40% per data published in Wikipedia) but to the extent that the exports consist of re-invoicing imports by multinationals to take advantage of Ireland’s tax competitiveness, Ireland is not a neighbourly country.
If we take out neighbourliness from the data and assume that all criteria have an equal weighting, Australia would move up to eighth position.
A quick word about other countries. The US ranks 19th, Brazil 63rd, China 85th, Russia 93rd and India 107th. Almost all the bottom countries are in Africa with Somalia the last of the 162 countries surveyed.
This a follow-up article written by Jim Wells to an article of the same name published in July 2016.
District Plans
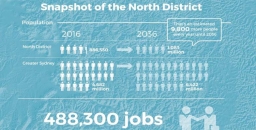
Have your say on the North District Plan and the Greater Sydney Strategy by 31 March 2017.
District Plans cover the plan for growing Greater Sydney in detail. Sydney is divided into six districts and ours is the North District.
Increase in Number of Dwellings
The table below summarises the implied new dwelling requirements from the population growth rates adopted in the Greater Sydney Strategy.
| Council | Existing 2011 | 2011–16 | 2016–21 | 2021–26 | 2026–31 | 2031–36 | Change 2011–36 | % change 25 years |
| Lane Cove | 13,900 | 1,650 | 1,350 | 1,250 | 1,900 | 1,900 | 8,050 | 58% |
| Ryde | 44,050 | 4,950 | 6,250 | 5,650 | 5,100 | 5,000 | 26,950 | 61% |
| Hunters Hill | 5,400 | 350 | 150 | 150 | 200 | 250 | 1,100 | 20% |
| Northern Beaches | 103,800 | 4,950 | 2,900 | 4,050 | 5,100 | 5,400 | 22,400 | 22% |
| Mosman | 13,750 | 550 | 300 | 250 | 350 | 400 | 1,850 | 13% |
| North Sydney | 37,000 | 2,950 | 2,750 | 2,700 | 3,100 | 2,900 | 14,400 | 39% |
| Willoughby | 29,050 | 1,900 | 1,200 | 1,400 | 1,850 | 2,000 | 8,350 | 29% |
| Ku-ring-gai | 41,050 | 3,150 | 2,750 | 2,850 | 3,300 | 3,250 | 15,300 | 37% |
| Hornsby | n/a as boundaries have changed | |||||||
Here is an example of how the increase in dwelling numbers could come from replacement of existing houses with higher density dwellings. If the average replacement ratio is three new dwellings for one original dwelling in Lane Cove, around 4000 existing homes (around 30% of the suburb) would be replaced by 12,000 new terraces/townhouses over 25 years.
The sheer scale of new housing and infrastructure that will be needed to accommodate the increase in population over the period 2016–36 means that the character of northern Sydney will change. That will not be the end of it. The growth is not expected to stop once 2036 is reached!
The financing for this development could create pressure for sale of public land. Alternatively it could be financed by concessions in the height and location of high-rise. Dwellings near open space (including bushland) are more valuable and provide greater capacity for ‘value capture’. We see this approach in the proposals for development in South Dural where the developer is applying for approval of six storey buildings adjoining a riparian zone.
Protection of Native Vegetation
STEP’s main area of interest is the likely impacts of extensive further development on our existing bushland and native vegetation and what the District Plans have to say about the future development and management of these areas. We are also concerned about the environment of Sydney in general with issues like:
- Will natural bushland on public and private land be maintained and improved?
- Will the green canopy cover from street trees and suburban gardens be maintained?
- Will there be sufficient wildlife corridors and preservation of habitat, eg tree hollows?
- Will the planning regulations allow developers to remove excessive amounts of vegetation?
- Will there be preparation for climate change in management of riparian zones and foreshores?
The North District Plan is a frustrating document. It makes encouraging statements but then provides little detail on how the intentions will be actioned.
It emphasises the rich natural environment of the North District located in national parks and reserves, public and private land (p131).
It states that more effective outcomes can be delivered through planning at a strategic level that:
… can consider opportunities to connect areas of biodiversity, the relationship between different areas and threats to natural features.
Does this mean considering cumulative impacts and wildlife corridors?
The future status of natural areas is unclear. Natural areas that are currently cared for under council plans of management need to continue to have protection as a special category of public land use. The Department of Planning has been reviewing the State Environment Planning Policy 19 that defines protection of urban bushland for well over a year. We should have this information by now so we know how it fits in with the District Plans. We understand that Tree Preservation Orders are included in this review.
The whole process is a quantum change from the past where a regulatory planning system, such as SEPPs protected our natural areas. We now have a strategic planning system which facilitates further development intensity and the strength of the regulatory protection is unclear.
The future conflicts are exemplified by the stated objectives of strategic conservation planning (p132), for example:
- Maintain and where possible improve the conservation status of threatened species and ecological communities.
- Achieve better outcomes for biodiversity conservation.
- Facilitate urban growth and development and reduce the cost and timeframes for development approvals.
- Provide an equitable model recognising and recovering the cost of biodiversity impacts from urban growth (the questionable offsets system).
Specific Issues
Some examples of specific issues that need to be addressed in the North District include:
- Protection of Gordon Flying Fox Reserve – flying foxes are a keystone species that are essential for the cross-pollination of native trees and their ability to adapt to climate change.
- Ensuring critically endangered ecological communities including Blue Gum High Forest and other rare vegetation are protected by the classification as Nature Reserves. These reserves are isolated pockets that are encroached by housing development. Bushland buffers need to be maintained around these endangered forest areas as well measures to ensure that the trees are not damaged by urban stormwater.
- Recognition of the special environmental attributes of the northern areas with unique vegetation arising from high rainfall and Wianamatta Shale Soils.
- The need for an upgrading of the BASIX requirements to allow for more extreme rainfall events that are accelerating damage and erosion to riparian zones. This is particularly noticeable due to the high energy water flows associated with the steep catchments in the North District.
Green Grid
The development of the Green Grid through the Metropolitan Greenspace Program is lauded by the District Plan as an important part of promoting a healthy environment. Broadly the Sydney Green Grid program is all about improving recreational spaces and their accessibility, including access to national parks. STEP is very concerned if it includes developments like bike trails through uncleared bushland, or exploitation for tourism such as leasing public land within national parks for hotels and camping areas.
The North District Plan refers to a detailed report that outlines the conceptual approach behind the Green Grid that is on the website. On enquiry we discovered that it has still not been released. Lack of key information including the changes to SEPP 19 is unacceptable and undermines the purpose of public consultation of the North District Plans.
The Greenspace program is funded by regular grants. $3 million was provided in 2015–16 and $4 million in 2016–17. $50,000 is going towards improving bush tracks in Hornsby. There is no long-term commitment to fund the program.
The North District Plan identifies some priority projects (p137). The proposal for Lane Cove River area is a concern. The description is:
Enhancing open spaces along the Lane Cove River foreshores to create unique recreational experiences linking the Lane Cove National Park to Macquarie Park. Macquarie University, Chatswood and Epping.
Will this involve clearing national park land? Currently this area of the river provides highly diverse habitat areas for native animals. On a recent STEP walk 50 native bird species were recorded. Mountain bike trails have so far been excluded from the LCNP. The area needs protection from high recreational use.
We have an opportunity now to tell the Greater Sydney Commission what is needed to ensure that Sydney’s unique environment is not destroyed by population growth.
Delving Deep into Caves can Teach us about Climate Past and Present

Have you ever enjoyed the cool refuge that an underground cave offers from a hot summer’s day? Or perhaps you have experienced the soothing warmth when entering a cave during winter?
When descending into a cave, you may not only enjoy the calm climate, you may also admire the beauty of cave deposits such as stalagmites, stalactites and flowstones, known by cave researchers as speleothems.
Perhaps you already know that they grow very slowly from minerals in the water that drips off or over them. This water originates from rain at the surface that has travelled through soil and limestone above, and seeped into the ground and ended up in the cave.
As speleothems grow, they lock into their minerals the chemical signatures of the environmental and climatic conditions of the time the rainwater fell at the surface. So, as a stalagmite grows, the surface climate signature is continuously trapped in the newly created layers.
Some very old stalagmites hold climatic signatures of the very distant past, in some cases up to millions of years. They contain an archive of the past climate as long as their age, often predating global weather station records.
Above and Below
But if a cave remains cool during summer and warm during winter, how is its climate related to that of the surface? And how does this affect the chemical signature recorded by speleothems?
To understand the relationship between surface and cave climate, our research group, Connected Waters Initiative Research Centre at UNSW Australia, conducted multiple field experiments at the Wellington Caves Reserve in New South Wales.
During the experiments, the surface and the cave climates were measured in detail. For example, highly accurate temperature sensors were used to measure the water temperature at the surface, and at the point where water droplets hit the cave floor forming stalagmites.
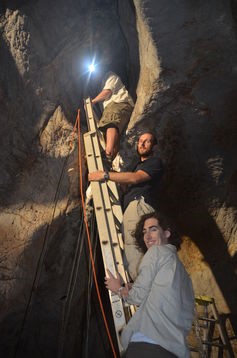
Installation of high-resolution temperature sensors inside the cave. Martin S Andersen
The research team initiated controlled dripping in the cave by irrigating the surface above the cave with water that was cooled to freezing point to simulate rainfall.
The cold water allowed us to determine whether the drip water in the cave is affected by the conditions at the surface or those along its pathways through the ground.
We also added a natural chemical to the irrigation water, which allowed us to distinguish whether the water in the cave originated from the irrigation or whether it was water already present in the subsurface.
Our results revealed a complex but systematic relationship between the surface and the cave climate. For example, surface temperature changes are significantly reduced and delayed with depth.
Our research illustrates how to decipher the surface temperature from that in the cave. Understanding this is necessary to correctly decoding past surface temperature records from their signatures preserved in stalagmites.
Keeping it Cool
We also discovered that air moving in and out of the cave can cool cave deposits by evaporating water flowing on the cave deposits. This cooling can significantly influence the chemical signature trapped in the cave deposit and create 'false' signals that are not representative of the surface climate.
In other words, it will make the surface climate 'look' cooler than it actually was, if not accounted for. While this is more likely to occur in caves that are located in dry environments, it may also have to be considered for stalagmites in caves that were exposed to drier climates in the distant past.
Our new knowledge can also help scientists select the best location and type of stalagmite for the reconstruction of past climatic or environmental conditions.
This new discovery is significant because it can improve the accuracy of past climate signals from cave deposits. It may also help us understand previously unexplained artefacts in existing past climate records. By improving our understanding of the past climate we can better understand future climate variations.
(![]() Photo at the top of page is of temperature loggers installed on stalactites to measure the drip water temperature. Martin S Andersen)
Photo at the top of page is of temperature loggers installed on stalactites to measure the drip water temperature. Martin S Andersen)
Gabriel C Rau, Associate Lecturer in Groundwater Hydrology, UNSW Australia; Andy Baker, Director of the Connected Waters Initiative Research Centre, UNSW Australia; Mark O Cuthbert, Research Fellow in Hydrogeology, University of Birmingham, and Martin Sogaard Andersen, Senior lecturer, UNSW Australia
This article was originally published on The Conversation. Read the original article.
Annual Report for Year to Oct 2016

In last year’s Annual Report I noted the transformation happening in Sydney and the unknown impacts on our bushland, the preservation of which is the primary focus of STEP’s activities. We are none the wiser with major pieces of legislation still in the formative stages. So the focus in 2016 has been on broader rather than local issues.
Committee
We are lucky to have a committee with a wide range of skills including ecology, landscape and bushland restoration, the intricacies of planning regulation and web communications. These people have been hardworking committee members for many years. We would welcome new ideas and experience. We recently emailed a survey aimed at discovering if there are any members, or people members may know, who could contribute in some way to STEP’s activities.
I would particularly like to thank Helen Wortham for the fantastic work she has done in getting the new website up and running and setting up the system for emailing the newsletter. Many hours have gone into getting the email addresses updated and developing a presentation that is very clear and attractive.
I would also like to thank Frank Budai for all his work over the past 3 years as treasurer, keeping track of our finances and organising the audit of our financial statements. Frank has resigned so we are looking for a new treasurer.
Publications
We have reduced the prices of our books and sales have been similar to recent years. Map sales are still solid. Our maps are more detailed than generally available on-line and there is no better way to plan a walk than poring over a full-size paper map.
The new Lane Cove Valley map is about to be printed using the more durable ‘stone’ paper that is waterproof. We are thankful for having a large team of volunteers who have been ground checking the new map that has been masterminded by John Martyn. Copies will be available before the end of the year.
Accounts
Our finances show a deficit of $3,550 for the year to 30 June mainly from a write down in the value of our stock of publications. Until now the major expenditure item has been the cost of production of the newsletter. This cost will be lower in future because of the use of email for distribution.
We have maintained the Environment Protection Fund which provides Deductible Gift Recipient (DGR) status for donations that support STEP’s environmental objectives. We received a total of $350 in donations in the past financial year. The government has been reviewing the criteria for providing DGR status. The current recommendation from a parliamentary report released just before the election is that this status should apply only if at least 25% of an organisation’s expenditure relates to on ground environmental work, however that can be defined. There is a risk that many environmental organisations will lose their DGR status.
Electronic Media
Our website has been upgraded and rebranded so that there is full functionality on tablets and smart phones and well as old-fashioned computers. New features include a secure shopping cart where you will be able to order and pay for publications and membership on-line. There is a simple system for registering for our walks. If you haven’t had a look, please do.
Trish Lynch creates an innovative Facebook page with an attractive selection of photographs and alerts of current local events and issues.
John Burke looks after our Twitter feed with incisive comments on current environmental affairs.
Education
We support the Young Scientist Awards run by the Science Teachers’ Association NSW with a prize in the environmental sustainability category. The winner of our award in 2015, Jade Moxey went on to win the overall Young Scientist of the Year and international awards as well. She has extended her project this year and is again our winner. There was another worthy project so we have also awarded a runner up prize this year. It is great to see the interest the students have shown in environmental research.
The Environment Protection Fund can be applied to educational and research projects. Ideas and proposals are welcome.
Talks
We organised public talks over the past year on Sydney’s birdlife, the unique geology revealed by the Hornsby Quarry, Wahroonga Waterways Landcare, exploration of the seafloor and land snails.
We did not manage to organise a STEP lecture last year as the potential speaker was not available.
Walks
STEP organises a walk every month or two (eight since our last AGM) in both our local area and further afield. Two of the walks focusing on birds were very popular. We also introduced members to some very different plant communities in western and south-western Sydney. The walks aim to be educational and to encourage new walkers so most walks are not physically challenging. We thank Andrew Little and John Martyn for organising and leading walks. If you have a request for a walk please let us know.
Newsletter
Our newsletter, STEP Matters, is our main means of communicating events, our activities and issues with our members. We also include other articles with an environmental angle that will be of interest to members. The newsletter is also sent to local councillors and politicians. We welcome alerts from our members of local events and developments and, of course, feedback on articles is always welcome.
We are now emailing the new editions to the majority of members and a few members still prefer a hard copy in the post. All past editions are available on our website going back to scans of the typewritten versions from 1978.
Environmental Issues
Despite the huge opposition on scientific and sustainability grounds to proposals to change the biodiversity conservation and land clearing legislation the Baird Government has given no hint that it is listening. There are also proposals to change Crown Land management that could have the potential to encourage commercialisation and alienation of green spaces. We are soon to be invited to comment on a broad picture framework for the development of Sydney over the next 20 years as set out in District Plans drafted by the Greater Sydney Commission. STEP’s major concern is whether there will be adequate provision for the maintenance of healthy bushland and tree canopy within our suburbs in the face of rapid unsustainable population growth. We urge everyone to get involved by sending comments to the Greater Sydney Commission.
Then there is the prospect of council amalgamation hanging over our heads. It is likely there will be a period when we will have no local representation with decision making taken over by an administrator appointed by the government. Once amalgamation is bedded down there is uncertainty about the application of planning instruments where, for example building standards or tree preservation orders could be set at a common standards that will lead to denser development in low and medium density residential areas and loss of the current treed character and amenity of many Sydney and other coastal areas.
One local issue is the outcome for the Hornsby Quarry after it has been filled with spoil from the NorthConnex tunnels. We have been unable to get any assurances that the rock face of the volcanic diatreme will remain visible.
New Lane Cove Valley Map
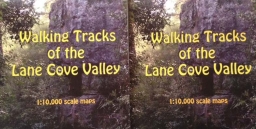
Yes, the brand new Lane Cove Valley map is now available. It has been produced by John Martyn with his keen eye for detail and clarity. We are grateful to have had the assistance of a team of walkers who checked the details of the tracks and names of streets etc.
The map covers a larger area than the old map going further north and west to cover the major connection points from the North Shore railway line and Pennant Hills.
The price is $15. For STEP members the price with the usual 30% discount is $10.50. Order your copy now!
Please note that you do not need to have a PayPal account in order to use PayPal to make a payment.
Warrimoo Mountain Bike Track – Some Good News
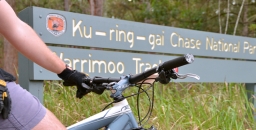
Previously we've reported on Ku-ring-gai Council’s closure of the mountain bike downhill track that had been constructed illegally near Warrimoo Oval in St Ives. After strong protests from the mountain biking community, including attempts to remove the fencing used to close the track, council undertook to commission independent ecological and safety investigations into the track. In July 2016 council announced that the research supported its decision to close the track so this will happen permanently.
This track has been evolving over several years and was tolerated by council under the Unstructured Recreation Strategy even though it was constructed without approval. However the listing of Coastal Upland Swamps as an Endangered Ecological Community (EEC) in 2012 under the NSW Threatened Species Conservation Act 1995 changed all that. A determination to list Coastal Upland Swamp as an EEC under the federal Environment Protection and Biodiversity Conservation Act 1999 was made in 2014, further strengthening the need for protection and the legislative requirement of council as the land manager to ensure its protection.
Key Findings from the Independent Report
The independent assessment determined:
that the creation and use of the mountain bike track has had a detrimental impact on the local occurrence of the Coastal Upland Swamp EEC and threatened species and their habitats.
The threatened species include Melaleuca deanei, Tetratheca glandulosa, Eastern Pygmy-possum, Rosenberg’s Goanna and Red-crowned Toadlet within Ku-ring-gai.
It also deemed the mountain bike activity ‘not sustainable’ due to the loss of vegetation and habitat, soil loss and irreversible localised changes to hydrology.
If use of the track were to continue, further degradation of the EEC and threatened species habitats could be expected:
A significant amount of work would be required to bring the track up to IMBA standards and these works are not recommended as they would cause further damage to the environment.
Council is currently looking into possible alternative sites that may accommodate downhill mountain biking in an ecologically sustainable way. The area at Lovers Jump Creek Reserve (Golden Jubilee) is the best and most suitable site. If council were to pursue track development a more detailed impact assessment would be required.
Having Trouble with Plant Names?

Knowledge of some of the common endings of scientific names can help to make names less forbidding. It is well worthwhile learning some of them.
A plant named after a person may end in ‘i’, ‘ii’, ‘iae’ or ‘ana’:
- -iae indicates that the plant was named in honour of a female, e.g. Acacia kettlewelliae from the subalpine areas of Victoria was named in honour of Mrs A Kettlewell, who was one of the founders of the Wattle-day League in 1909
- -i or -ii indicates that the plant was named after a male, e.g. Acacia beckleri was named in honour of the German born Dr Hermann Beckler, and Acacia williamsonii after Herbert Williamson, a teacher and botanist – usually (but not always) an i or ii ending means that the person named was the first to find the plant
- -ana indicates that the plant was named in honour of someone other than the finder. Acacia baileyana was named after FM Bailey, a prominent Queensland botanist. Sometimes the -ana ending is used after a place name, e.g. Eucalyptus papuana, the Ghost Gum of Central Australia
- -ensis indicates a native of the area named, e.g. Eucalyptus delegatensis is from the town of Delegate in south-eastern NSW. Note that austalis means southern and australiensis means inhabiting the south
- -oides means ‘resembling’, e.g. Acacia asparagoides is asparagus-like
- -cola means ‘native of’, e.g. Acacia saxicola is an inhabitant of rocky places
- -ella means ‘diminutive’, e.g. Dianella is the diminutive form of Diana
- -escens means ‘becoming’, e.g. Acacia glaucescens means becoming glaucous (powdery white)
- -osus or -osa indicates ‘abounding in’, e.g. the Common Fringe-lily Thysanotus tuberosus is abounding in tubers, and Acacia dentulosa is abounding in teeth
- -folia or -phylla refers to the leaves, e.g. Acacia brevifolia has short leaves, Acacia juncifolia has juncus (rush like) leaves, Acacia aciphylla has sharp, needle-like leaves, while Acacia aphylla is leafless. Acacia genistfolia has leaves resembling those of Genista (the brooms)
- -issima means ‘very’, e.g. Acacia aculeatissima is very prickly, and Acacia elegantissima is very elegant
- -ata indicates ‘a little’, e.g. Acacia crenulata has leaves a little bit crenulated (toothed) and Prostanthera denticulate has little teeth on its leaves
- -dentata means ‘toothed’, e.g. Acacia bidentata means two toothed
So next time you see Eucalyptus balladoniensis you will know that there is a town or district called Balladonia, and because there is a eucalypt called Eucalyptus burracoppinensis, there must be a place called Burracoppin.
And Eucalyptus brockwayi was named after Mt Brockway. One of the plants in the local bushland is the Bedstraw, Gallum gaudichaudii, so there must have been a Mt Gaudichaudi. And Acacia victoriae was named after a female, actually a queen. If it was named after Victoria, it would have been called Acacia victoriensis.
But some names are a simple giveaway, such as Persoonia hirsuta, the hairy geebung.
This article has been reproduced with permission from an item in Blandfordia, the magazine of the Australian Plant Society NSW Ltd, North Shore Group
Lane Cove Valley Metrogaine

On Saturday 25 February 2017 the NSW Rogaining Association is holding LaneCoveRivergaine3, backing up the very successful LaneCoveRivergaines 1 and 2 in 2015 and 2016.
Rogaining involves teams of 2 to 5 people navigating to checkpoints marked on a map.
This is a great community event. Over 400 entrants of all ages (6 to 80+) and abilities are expected – from elite athletes to walkers and families. You get to choose your own route and level of difficulty and how long you take, within the 6 hour time limit.
You don't need special gear. Comfortable jogging or walking shoes and appropriate clothing are fine. Food and water should be carried, though bubblers and shops are located throughout the area and are marked on the map. A compass isn’t essential, but would be useful.
Start (11 am) and finish will be at Blackman Park, Lloyd Rees Drive, Lane Cove.
Instruction will be available for all first timers. Just form a team and register on-line (in January).
Enquiries: 0419 663 539 or This email address is being protected from spambots. You need JavaScript enabled to view it..
As for the two previous events, John Martyn has modified the STEP map of Walking Tracks of the Lane Cove Valley for the event. The location is the lower Lane Cove River Valley from Epping Road Bridge to Fig Tree Bridge, and surrounding suburbs. And John has helped to identify the most spectacular tracks and vistas for the event.
NSW Government Ploughs on with Controversial Legislation
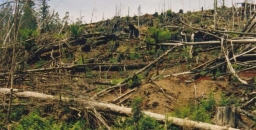
There has been a flurry of legislative action and announcements during the final months of the year following varying periods of consultation. The concerns about the legislation have been covered in recent issues of STEP Matters and more details are provided by the peak bodies leading the campaigns, the Nature Conservation Council and Total Environment Centre. Here is a brief update concentrating on the implications for urban areas.
Crown Land Management
The new Crown Law Act was pushed through state parliament on 9 November. The government claims that the new legislation will reduce complexity and deliver better management. It is expected that commencement will be in early 2018 after the required policies and systems have been prepared.
Submissions to the inquiry pointed out that, in fact, the problems with the current legislation are with administration, not the act itself. There are many examples of the misuse of crown land, for example the Talus Reserve in Willoughby that Willoughby Council allowed to be taken over by commercial interests that have generated a private profit.
Under the new legislation crown land may be transferred to local government or vested in other NSW government agencies. It is unclear whether they will be given the financial resources to carry out these new responsibilities. It seems there would be no barriers to councils classifying the land as operational land that could be sold or leased for development without any community consultation. Time will tell!
Climate Change Policy
One item of good news is that the NSW government announced a policy to reduce greenhouse gas emissions to zero by 2050. The announcement documents contain lots of statements of intention but most of them are dependent on federal government policy and action.
The sincerity of the government’s policies are now called into question. A Climate Change Fund was established by the NSW government in July 2007 to help households, businesses, community organisations, schools and government to save water, energy and greenhouse gas emissions. We now learn that the $240 million for private land conservation under the new Biodiversity Act will come from this same fund ‘to help landholders and land managers reduce the impacts of climate change on natural systems’.
Biodiversity and Land Clearing Laws
On 17 November the biodiversity laws were passed with the help of the Shooters and Fishers and Fred Nile’s Christian Democrats in the Upper House. Over 7,000 submissions were received with the majority expressing alarm about the prospects for increased land clearing and relaxed biodiversity offset provisions. Some minor changes have been made to the draft bills:
- Some vitally important areas will be excluded from the land clearing codes which means that it will be harder for farmers to clear them. These areas include coastal and Ramsar wetlands, littoral rainforest, core koala habitat, critically endangered ecological communities, old growth forests and high conservation value grasslands.
- The act ensures that the Office of Environment and Heritage will remain responsible for compliance and enforcement of the legislation, rather than the Department of Primary Industries as the government originally suggested.
- The Minister for the Environment and Minister for Primary Industries have the power to stop the use of land clearing codes under certain circumstances which is significant due to the expansion of codes under the new legislation.
- The use of biodiversity offsetting is greatly expanded under the new legislation which is a significant concern, however the final legislation has improved the offsetting provisions by requiring the minister to ensure that offsets result in ‘no net loss’ of biodiversity. This creates the opportunity to pressure the minister to adopt a more strict interpretation of offsetting that will have tangible result for bushland across the state.
Further consultation will occur on regulations that are yet to be released on aspects such as ‘red lights’ for development that impact on critically endangered species, testing of the Biodiversity Assessment Method that will determine how the impacts of development on biodiversity are managed and the long awaited State Environmental Planning Policy that will decide the fate of urban vegetation and biodiversity.
The government is still trumpeting the benefits that will come from private conservation actions but it is unclear how this can compensate for lost vegetation and habitat in other areas and that there will be sufficient long-term funding. In fact it has recently been discovered that the Climate Change Fund has been raided to provide funding for private land conservation.
Draft land clearing codes and regulations will be released early in 2017 for consultation.
Greater Sydney Commission District Plans
The much anticipated District Plans were released on 21 November. Submissions may be made up to the end of March and the intention is to finalise the plans by the end of 2017.
The District Plans cover the next 20 years. The overriding document is the Plan for Growing Sydney that covers development up to 2056. Over this time Sydney’s population is projected to grow from the current 4.6 million to 8 million.
On first perusal the District Plan for northern Sydney appears to recognise the value of our bushland and coastal environments. The detail is not available on how Local Environment Plans can be used in future to ensure the preservation of wildlife corridors and local bushland as well as national parks.
At forums organised by the Better Planning Network, commissioners have emphasised social and economic aspects of the plans. The environment seems to be a poor relation instead of being a vital consideration that will impact on socio-economic outcomes. For example, who wants to live in a concrete jungle of high rise apartments with no shade or natural landscape nearby?
The consultation period provides an opportunity for the public to reinforce the importance of maintaining healthy quality green spaces, bushland and national parks that are identified in the District Plans. Please write a submission.
Review of Direct Action’s Ability to Meet our Greenhouse Commitments
In November the Turnbull Government ratified Australia’s commitment to comply with the Paris Agreement on Climate Change. Australia has set a target to reduce emissions by 26 to 28% below 2005 levels by 2030, which builds on the 2020 target of reducing emissions by 5% below 2000 levels. The 2030 target is equivalent to about 13% below 2000 emission levels so the 2030 target is not as good as it sounds.
Currently the government’s main plan to reduce greenhouse gas emissions to meet our obligations under the Paris Treaty is called the Direct Action Plan. Introduced in 2014, the scheme operates by reverse auction, funding projects voluntarily proposed by the private sector. Projects are selected on the amount of greenhouse gas emissions expected to be abated at the cheapest price. So far $1.7 billion has been allocated out of a budget under the Emissions Reduction Fund (ERF) of $2.55 billion over 4 years.
Direct action also involves an emissions ‘safeguard mechanism’ to discourage large emitters from increasing their emissions above historical benchmarks. It commenced on 1 July 2016. It is not clear yet whether the rules will be effective in controlling increases in emissions.
This article draws on two recent analyses of the effectiveness of the Direct Action Plan:
- Paul J Burke, Undermined by Adverse Selection: Australia’s Direct Action Abatement Subsidies, Australian National University, April 2016
- Margaret Blakers and Margaret Considine, Mulga Bills won’t Settle our Climate Accounts: An Analysis of the Emissions Reduction Fund, The Green Institute, November 2016
Risk of Adverse Selection
Paul Burke questions the effectiveness of the direct action projects because of fundamental flaws in the scheme design:
- There is no way of preventing the direct action scheme subsidising projects that would have gone ahead anyway. For example funding has been provided for replacing machinery that is inefficient and upgrading lighting in supermarkets. These projects would provide a financial benefit to the proponent in any case so a subsidy has no justification.
- The international rules of carbon accounting require additionality. This means that credit for emissions reductions must not include changes that would have occurred anyway, say, because of legislation.
- The information about emissions expected to be abated will depend on a definition of baseline emissions, that is, what emissions would have been if the project had not been implemented. It is the proponent’s responsibility to identify their baseline in accordance with approved methods, and there is some flexibility. The government’s inability to know true project baselines creates a major challenge. Projects with overgenerous baselines will be able to submit relatively low auction bids because the abatement they offer will be easy to achieve, and thus cheap. These bids are well placed to secure funding. If the baseline is higher than business as usual, in the end the project will deliver less abatement than notionally indicated.
Effectiveness and Value for Money of Abatement to be Delivered
Margaret Blakers and Margaret Considine have undertaken the first ever analysis of the ERF auctions. They found that direct action not only fails its own test of delivering ‘real and additional’ emissions reductions, but also that it cannot serve as the foundation for more serious action without very substantial changes to its architecture. Their key findings are:
- Large sums of money (around $1.2 billion) have been poured into protecting land sector carbon. At the same time there is no federal policy safeguarding existing landscape carbon stocks. They are turning a blind eye to state governments rolling back land clearing controls. The entirety of the abatement purchased by the ERF so far (143 Mt CO2-e) at a cost of $1.73 billion accounts for less than 20% of projected emissions from land clearing up until 2030.
- Over half of all abatement comes from just two mulga-dominated bioregions in south-west Queensland and western NSW. The value of ERF contracts in and around these regions is about $1 billion. With carbon payments estimated to average $195 per hectare, this represents many times the per hectare value of land in the region. Paul Burke makes a similar point. This situation only applies to land with existing land clearing permits predating 1 July 2010. The payments rest on the assumption that clearing would have happened without the subsidy. No doubt some vegetation has indeed been preserved, albeit at a high price. Some of the spending has questionable additionality, however, given that the incentive to clear was anyway rather low (clearing is expensive and the productivity of the land is low).
- Much of the scheme’s expenditure has either been wasted or is at risk due to doubtful additionality (as per Paul Burke’s examples) and lack of permanence. 25% of ERF abatement has a ‘permanence’ period of only 25 years, after which time landholders regain ‘full land-use flexibility’. As well, the concentration of abatement in the semi-arid mulga regions carries its own risks such as from drought and climate change itself.
Fundamentally the ERF abatement profile is at odds with Australia’s emissions profile. Over 80% of our emissions are from industry, but 80% of direct action abatement is from the land sector. Only 4% is from the energy and industrial processes sectors, which produce most of Australia’s emissions.
Inadequacies in Methods for Vegetation Abatement
All the methods apply to ‘forest’ which is defined under the international rules. No methods are available at present for non-forest native vegetation or existing native forests on public land. Native forests on private land protected by legislation or covenant do not qualify because they are required by law to be protected.
Most landscape carbon resides in natural ecosystems. If well-managed, these will be resilient and are likely to persist and accumulate large carbon stocks in soils and plants over decades and centuries. Natural ecosystem management requires coherent, continental-scale policies and funding for the long term coordinated by the states and Commonwealth, not the ad hoc project funding that direct action provides.
The ERF is failing the climate, failing the land sector and failing the budget. To be credible, Australia’s climate policies must address the land sector in its own right and must stem the loss of carbon from the landscape caused by clearing, logging and other forms of degradation.
Ultimately the only effective long-term strategy to reduce Australia’s greenhouse gas emissions is to place a direct price on emissions.
Young Scientist Awards 2016

In 2015 the winner of STEP’s prize for a project relating to an environmental issue was awarded to Jade Moxey from Sapphire Coast Anglican College This year she has done it again with a project that extended her previous research that scotched theories that cattle grazing can stop the spread of weeds. She showed that fireweed is similarly not controlled through sheep grazing. Then she showed great initiative in organising testing of whether the toxic alkaloids in fireweed have the potential of health impacts for sheep and humans.
We also decided to give a highly commended prize to Darryl Domer and Carlos Meier, home schooled, for an evaluation of cell grazing compared with conventional open paddocks. They found that cell grazing provided significant economic and ecological benefits including increases in water use efficiency, pasture productivity and plant biodiversity. The results showed that that cell grazing could provide a potential solution to global food security when applied to a larger scale.
Marian Haire awarded STEP’s prizes.
South Dural Rezoning Proposal is Alarming
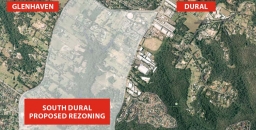
South Dural Residents and Ratepayers Group, a developer initiated lobby group, has made numerous applications since 1990 to Hornsby Council for the rezoning of 240 ha of rural lands in south Dural for urban purposes. The latest attempt is currently under consideration. Click here for details of the history of the lobbying
In the latest attempt, consultants’ reports have been commissioned as part of the first step of the application, that is, to change the zoning from rural to various levels of residential density and recreational zoning. Submissions closed on 2 December.
The spine of the proposed development is an area of bushland along Georges Creek and another unnamed tributary of Berowra Creek. Indeed the developer is touting the natural views and the tall forest as a feature that will allow six storey apartments to fit into an ‘eco-friendly’ community. All in all the proposal is for 2,900 dwellings that could house 9,000 people.
The bushland is of high conservation value with areas of Blue Gum High Forest (10.5 ha), Sydney Turpentine Ironbark Forest (22 ha), Blackbutt Gully Forest (30 ha) and Shale Sandstone Transition Forest (1.4 ha). The first two listed are classified as critically endangered ecological communities under the federal Environment Protection and Biodiversity Conservation Act.
As the opposing residents’ group, the Galston Area Residents Association, points out there are many reasons to oppose the application, for example:
- it is inconsistent with the metropolitan plan to preserve remaining rural land
- current roads cannot cope with current traffic let alone that generated by the extra residents
- public transport is inadequate and the north west rail line is a long way away so buses will have to operate on clogged roads
- there is insufficient provision for schools, shops, recreation areas and other basic infrastructure
STEP opposes the rezoning application for three main reasons:
1. Inadequate vegetation data and mapping
The bushland area comprises about 64 ha, a quarter of the site. As large parts of the land are privately owned it has not been possible to carry out on the ground vegetation mapping. This applies in particular to the area of Blue Gum High Forest of about 10 ha. This is in the context of the total area of Blue Gum High Forest remaining in Sydney of less than 200 ha. Other areas of significant vegetation have not been sampled adequately or consistently.
It is totally unsatisfactory to be asking the public to comment on such inadequate information, especially when dealing with endangered ecological communities.
2. The proposed zoning map does not reflect the described development or the stated purpose to conserve native vegetation
The higher density six storey buildings are planned to be built closest to the bushland but they are zoned R3 (medium density). It should be zoned R4, high density residential.
There are also inconsistencies in the minimum lot sizes of 125 m2 and 225 m2 stated in different parts of the proposal documents. The prospect of lot sizes of 125 m2 is alarming! No room for trees.
Most of the riparian areas are described as having high conservation significance so should be zoned as E2. However the proposed zoning is RE1. It appears the intention is to allow a gravity feed sewer to be installed along the creek lines, hardly compatible with conservation. Construction of a sewer would need road access that would damage the natural creek line and, on past experience, create a wide band of weed invasion.
3. Large areas of the zoning proposal are deferred
The deferred areas are the main bushland strips that interface between the residential areas and the core riparian areas. They cover a significant part of the bushland. The reason given is the uncertainty of the biodiversity legislation that had not been passed when the proposal was submitted.
These deferred areas will be hard to manage because of the proximity to the housing development so government agencies will probably not want them.
An absolute tragedy would occur if they were traded for biobanking sites elsewhere as it would be impossible to find equivalent vegetation communities to be restored to offset the losses. They should become areas that are off-limits to biobanking.
The effect of this proposal on the existing vegetation will be very damaging unless very detailed precinct plans to protect it are drawn up and very active and expensive management takes place in perpetuity.
It is unsatisfactory to expect the public to comment on this proposal with incomplete and inadequate information.
Summary
Ideally STEP would like this parcel of land to remain rural, but in the event of it being rezoned for residential development STEP would like the potential impact on biodiversity reduced. Possible mechanisms for this include:
- The RE1 zoning changed to E2 to allow better management of the biodiversity values
- The deferred areas to be zoned E2
- The areas zoned E2 to be managed by the local council with the provision of funding for long-term management from the developer
- The area currently proposed for R3 (medium density) should be greatly reduced with a zoning of R2 (low density) in areas with scattered trees
- Very limited R4 (high density) set well back from the bushland
- The minimum lot size for dwelling houses and semi-detached houses increased well above 225 m2, preferably up to 500 m2
- Find an alternative to gravity-fed sewers down the creeks
- Development set further back from the areas of biodiversity constraints so that the bushland edges are not as severely impacted
- Provision of buffering by revegetation should be considered along bushland edges
Hawkesbury Sandstone Shale Lenses
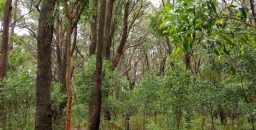
Most people who live in the upper North Shore and who are interested in bushland, or gardening, or geology, or maybe all three, would be conscious of whether they live on ‘shales’ or ‘sandstones’. They might also be aware that the shales generally overlie the sandstones, or so it would seem. But I had a conversation once with a lady who lives at Duffys Forest who believed that she and her neighbours lived on ‘Wianamatta Shales’. Well it was a reasonable assumption – but incorrect!
The shales that were once extensively quarried at Duffys belong to a thick lens some 140 to 170 m above the base of the Hawkesbury Sandstone, and at these levels and geologic times, the meandering, braided river channels that deposited the sands were starting to pond, and flood plain lagoons became more extensive and persisted for longer, accumulating clays that were preserved beneath further layers of river sand; or torn up and redeposited as sand with shards of shale. Eventually the sand was washed down only in intermittent flood bursts; its sand bars invading the muddy lagoons and the sands interlayering with the clays and silts, creating the transitional Mittagong Formation. The clays then took over as the river basin became a swampy, Triassic coastal lowland, and the Wianamatta Group was formed, but more about Mittagong and Wianamatta in later articles.
Shale Lenses: Form and Size
Hawkesbury Sandstone shale lenses lie sometimes only a few tens of metres or less below the stratigraphic top of the sandstone and they have been mapped and interpreted in different ways over the years. Without drill data it can often be difficult for a field geologist to know if scrappy, lateritised shale floaters and outcrops on a ridgetop are lying within or on top of the sandstone. As such, they were mapped sometimes as outliers of Wianamatta Group or Mittagong Formation, but latterly they have tended to be pushed down into the sandstones. A good example of such ambiguity would be the lateritised shale ridge capping at St Ives Showground, whose topographic setting could fit it into either category. Not only do such shale lenses tend to increase in frequency upwards in the sandstone sequence, but they are more common northwards and towards the coast.
Most lenses are just oversized slivers less than a metre thick and tens to hundreds of metres in lateral extent, and they tend most commonly to consist of laminite: a thinly bedded (mm to cm) alternation of shale, siltstone and sandstone. If you're out and about there are several places you can see them such as the south wall of the Argyle Cut in the Rocks. And on the M2 at Barclay Road overbridge, North Rocks, the NorthConnex guys are excavating a sandstone face with a laminite lens, though this may well soon be concreted over. There's a great example on the cliff top north of Wattamolla, and then there's Beacon Hill, just off Warringah Road, where shale once quarried for ceramics is still visible at the base of the hillside flanking the sports oval. This lens is more substantial and actually yielded numerous fish fossils of freshwater affinity.

Laminite – millimetre-thick alternating layers of sandstone and shale, Wattamolla cliff top
The Beacon Hill shale lens is thick, but not as thick as the Duffys Forest lens which was 35 m thick before quarrying. Thick also was a lens at Lucas Heights which is of the order of 10 to 20 m. Substantial lenses also occur at Canoelands, Kirrawee, Menai and Darkes Forest, and most of these larger ones tend to carry shale and mudstone in addition to laminite. There is a very readable account published on-line by ANSTO of the Little Forest lens at Lucas Heights, in which the author found little difference between its shale and typical Ashfield Shale of the overlying Wianamatta Group.
In terms of area, the larger lenses may originally have covered several square km, though because they were formed in lagoons and oxbows there is a tendency for them to appear long and narrow. The Darkes Forest lens for example extends along its ridgetop for nearly 4 km and the Duffys Forest lens measures 3 km in outcrop from north to south.
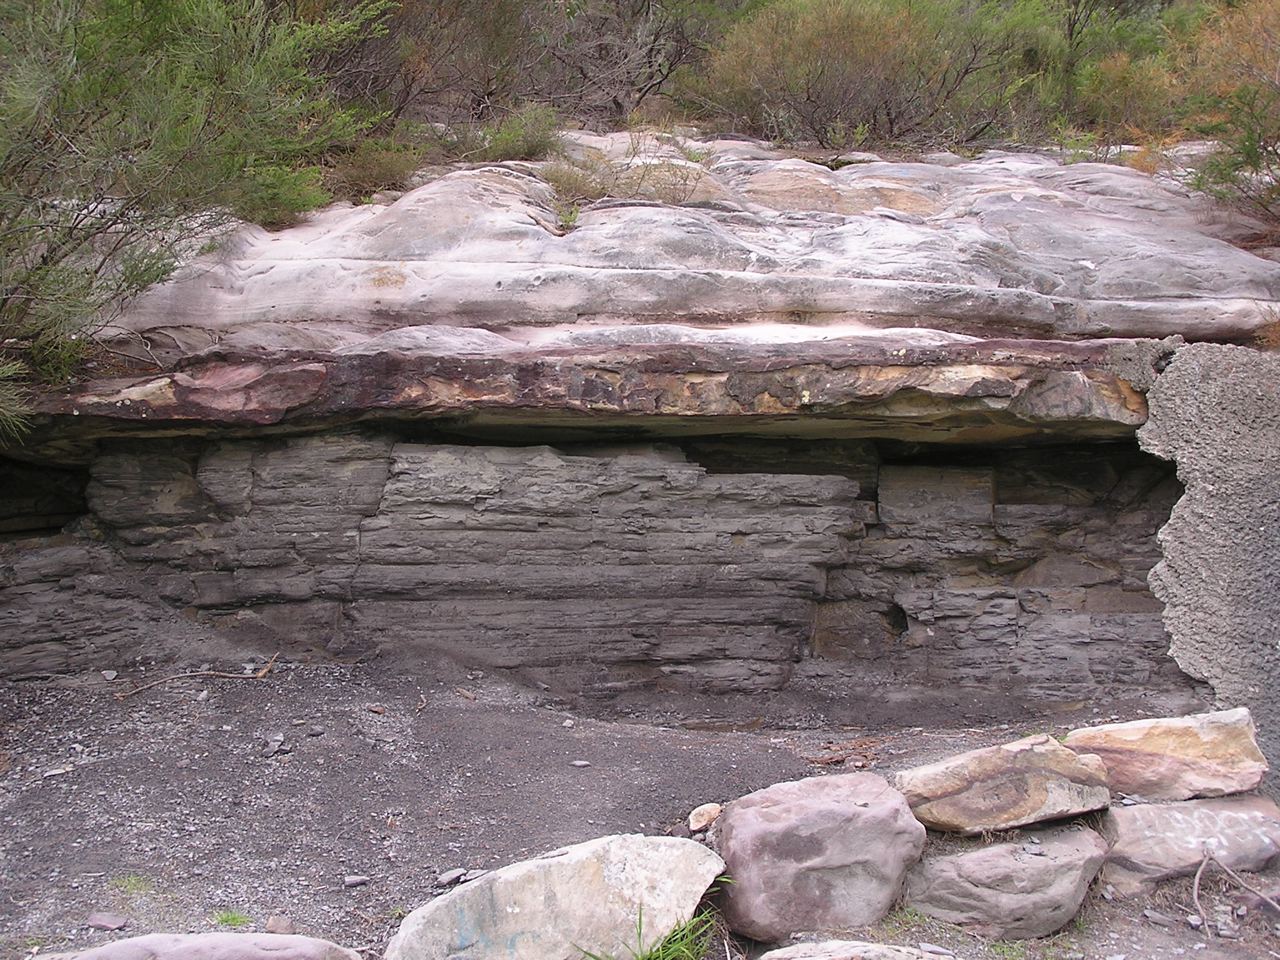
Shale/mudstone overlain by sandstone in former wall of Beacon Hill Quarry
Shale Lenses and their Vegetation
The shale lenses have a marked effect on soils, and this is reflected of course in the vegetation. Shale soils being more fertile have often been cleared for orchards and smallholdings, as at Darkes Forest and Canoelands, though there are significant surviving natural vegetation remnants, as described below.
Darkes Forest
I first stumbled on Darkes Forest by following the signs to the orchards from the Princes Highway, and was surprised to drive past quite tall forests of straight trunked trees; quite a contrast to the sandstone woodlands and shrublands along the highway. The forests are catchment protected so it's unwise to venture too far in, but it's easy to distinguish White Stringybarks, Sydney Peppermints and Sydney Red Gums shading an open floor peppered with tall shrubs of Two-veined Hickory Acacia binervata and a variety of other species including Gymea Lilies. About 200 ha of this forest remains, and has been declared as O'Hares Creek Shale Forest community and listed as endangered. See photo at the top of the page.
Menai
You may drive past the 5 ha Halls Drive Bushland Reserve off New Illawarra Road without noticing it, and be unaware there is any shale in the area, but venture in and you'll see shale fragments in the soil and be confronted with several species of eucalypts of both shale and sandstone affinity. It's probable both White and Common Sandstone Stringybarks are present as are Red Mahoganies, and these are accompanied by Sydney Red Gums and scribbly gums (unsure of species). The last two are perfectly at home on sandstone, but there are also abundant Blackthorns Bursaria spinosa – shrubs more typical of shale terrain. The plant community falls within the broad embrace of the critically endangered Shale Sandstone Transition Forest community.
Kirrawee
The 1:100,000 scale published geology map shows a chain of shale bodies running for 10 km along the ridge line between Sutherland and Cronulla. These are almost entirely built over except for some tiny patches of bushland adjoining Kirrawee railway station. These feature grassy woodland dominated by Grey Ironbarks and are a good example of Sydney Turpentine Ironbark Forest.
Beacon Hill–Frenchs Forest
The only surviving bushland on Beacon Hill itself is totally on sandstone not the shale of the former quarry, but shale lenses mapped around Frenchs Forest nearby carry surviving forest and woodland, though this has been under recent threat from hospital and road construction. A tree that can still be found there is White Mahogany Eucalyptus acmenoides, a shale-loving northern species also common in Edna Hunt Sanctuary near Epping, both areas at the southern limit of its natural range.
Duffys Forest
This semi-rural ridgetop settlement spreads across sandstone and shale, extending over the old shale quarry which has been manicured into a housing estate, country club and golf course. Much of the shale-related bushland was lost in the quarrying but some survives on its north-east and south-west sides. Whether it's truly Duffys Forest plant community may depend on interpretation, as key Duffys species such as Brown Stringybark Eucalyptus capitellata and Caley's Grevillea Grevillea caleyi are either absent or extremely hard to find there.
Trees that can be found include common species like Red Bloodwood, Silvertop Ash, Common Sandstone Stringybark, Sydney Red Gum and Christmas Bush, with a scattering of Blackbutts and Turpentines. The tree flora has affinities with both Duffys Forest and Shale Sandstone Transition Forest communities.
The shale is heavily lateritised, and iron-rich laterite debris have accumulated downslope on sandstone benches and in hollows. Among the species supported in such sites are a wealth of Proteaceae including Waratahs.
Berowra
When you walk from Berowra to Berowra Waters you descend to a firetrail that follows the contour. The hillside here has flattened into a broad bench and there are numerous shale and siltstone fragments in the soil. A shale band has created an aquiclude, wetting the soil to support abundant Umbrella Fern groves, plus thickets of the green-flowered Grevillea mucronulata; not a common plant on the North Shore but very abundant here. The Berowra example is a departure from the ridgetop shale settings and threatened, shale-related plant communities, and if any threatened community is represented there it is Coastal Upland Swamp.
Canoelands
The name of this locality is said to derive from timber getters finding stringybark ‘canoe trees’ with scars from bark removal. The stringybark was said to be Eucalyptus cephalocarpa but there are no known localities of this species north of Merimbula. The few hectares of bushland remnants among the Canoelands orchards carry tall straight stringybarks that are most likely E. globoidea. Such remnants have been mapped as critically endangered Turpentine Ironbark Forest in Hornsby Council's surveys.
This is the second in a series of articles by John Martyn on Sydney’s geology. Click here for his article on the Narrabeen Group.
BioBanking Activity in Sheldon Forest
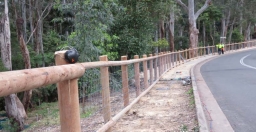
Sheldon Forest in Turramurra contains the second largest area remaining of the critically endangered Blue Gum High Forest covering an area of 5.4 ha. Sheldon Forest is linked to Rofe Park and Comenarra Creek Reserve so that the bushland extends from the railway line at Turramurra to Lane Cove National Park and provides an essential wildlife corridor that can potentially link Lane Cove National Park to Ku-ring-gai Chase National Park. It has been degraded over the years from fill from Warragal Rd and the rail cutting, weed invasion, storm water erosion, and waterlogging, feral animals, rubbish dumping and suburban encroachment.
In 2014 Ku-ring-gai Council signed a BioBanking Agreement with the NSW government under the Linking Landscapes through Local Action grant program. Council agreed to improve the reserves’ biodiversity values by undertaking management actions. These actions will create biodiversity credits and in return council has received grant funding.
Note: In many BioBanking schemes a developer purchases the credits and the money is used to restore a vegetation community elsewhere to make up for the loss caused by the development – see NSW Offsets Policy: A Dubious Way to Prevent Loss of Biodiversity (STEP Matters, Issue 181).
The BioBanking Agreement establishes a fund of $1.6 million that provides an ongoing, annual income to council to manage the bushland. The fund will give council annual management payments of between $100,000 and $130,000 for the first 20 years of the agreement, and thereafter about $40,000 each year in perpetuity. Council will contribute an additional $469,000 over three years to help manage the sites.
Action so Far
Anyone driving down Warragal Road, Turramurra just over the railway line will have noticed a lot of activity. Council has given us information on the works completed or in progress:
- In 2014 a sediment basin was constructed near the railway line and a large amount of ‘foreign’ soil was removed that had been dumped when the railway line was constructed. Creek stabilisation works were completed that were designed to encourage natural revegetation.
- Weed removal and preparation for ecological burns near Albion and Jubilee Avenues.
- Weed removal and stabilisation along Warragal Road.
- The revegetation of approximately 1800 m2 of Blue Gum High Forest using appropriate species and densities.
- Extensive fencing, both temporary and permanent, to assist with stabilisation and regeneration after the weed removal.
There will be much more work to do to ensure the permanent restoration of the native vegetation so that the weeds do not take over again.
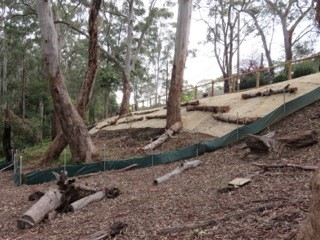 It should be noted that the sloping land adjoining Warragal Road is part of the council road reserve and is fill. As such it should be managed as a buffer to the Blue Gum High Forest in Sheldon Forest. The boundary between the two should be clearly delineated so that any erosion from the slope is managed and does not degrade the forest soil.
The stormwater outlet from Warragal Road discharging directly into Sheldon Forest is also a concern as it will have an impact on the viability of Blue Gum High Forest species in the affected areas. In the long term this stormwater should be redirected to an alternative sub-catchment.
The permanent fencing along Warragal Road is receiving a lot of comment. It is meant to be ‘non-intrusive’. Maybe it will weather to a natural colour?
Outcome of the Federal Election Bad for Climate Change Research and Action
Well the July election is done and dusted and the Liberal–National Coalition just scraped in. Despite Malcolm Turnbull’s previous statements about the need for serious action on climate change it appears that he does not have the political will to overturn past government decisions to downgrade climate change research and development.
CSIRO Cuts
CSIRO is an organisation independent from the government but still very much dependent on government funding. In February the CEO announced that climate science is settled so the focus can change to adaptation and mitigation. This statement was used to justify cutting over 100 climate change research jobs. Funding could be diverted to fields that could be more lucrative.
The size of the cuts was modified following an international outcry but there was still a cut of about 75 positions from the Oceans and Atmosphere division. Research is to be centred in Hobart in a new Climate Science Centre that will coordinate the work of 40 scientists carved out of existing CSIRO teams, and also tap into work by the Bureau of Meteorology and universities.
In August another modification was made when new Science Minister, Greg Hunt, ordered CSIRO to revive some other climate science programs in climate analysis and forecasting in Hobart. But these jobs will be financed out of the existing budget.
Fundamentally we still have less climate science capacity than before the cuts were announced. Some outstanding scientists with a huge accumulation of knowledge such as John Church, global sea level expert, will not return.
Support for Renewable Energy
There are plans to cut most of the funding for Australian Renewable Energy Agency as well as its ability to give grants. As the world responds to the urgent need to build new renewable electricity generation capacity, this plan is puzzling. Again the government’s reason is long-term ‘budget repair’. Australia has a long history of leading research into new solar technology. Hundreds of jobs will be lost from current research organisations and the potential opportunities for future commercialisation.
These policies conflict with the plans to help Australia become an innovation nation. The message from the government is that research is an expensive luxury rather an essential part of our long-term future.
We Need to Fight to Keep our Urban Forests
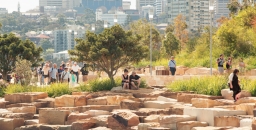
NSW residents are currently waiting for the state government to respond to the deluge of submissions opposing the new draft biodiversity and land clearing laws. The application of this legislation to Sydney’s bushland is unknown at present.
Urban Forests
Essentially there is a conflict between the need to accommodate the expectation of continuing high population growth and the desire to maintain a desirable city to live in. The high population growth is totally undesirable but we have had plenty to say about that before.
Now turning to the ideal of having liveable cities, one of the major elements is adequate tree cover. This is not impossible to achieve if there is the political will to get the planning right. Given the attitudes of the current NSW government to trees, residents will need to make it loud and clear that they will not accept a continuation of current policies.
In North Sydney Council’s Urban Forest Strategy document 2011, urban forest is defined as:
… the totality of trees and shrubs on all public and private land in and around urban areas and is measured as a canopy cover percentage of the total area. The canopy cover may vary in density depending on the vegetation type (eg almost solid cover under rainforest vegetation to more open cover under woodland or eucalypt forests) however the canopy cover percentage for urban forest measurement purely measures the percentage of land that has tree or shrub vegetation (over 3 m tall) above it, regardless of density.
Benefits of Urban Forests
Reduction in the Urban Heat Island Effect
Heat from the atmosphere is used in vegetation transpiration processes which convert water from leaves to water vapour. This has a cooling effect similar to that when humans perspire. Trees can transpire significant volumes of water and it has been estimated that a mature tree can transpire up to 150 L/day. In a hot dry location this produces a cooling effect similar to that of two air conditioners running for 20 h.
Much of the urban landscape is paved and devoid of vegetation. This means that there is usually little water available for evaporation, so most available natural energy is used to warm surfaces. Construction materials are dense, and many – particularly dark-coloured surfaces like asphalt – are good at absorbing and storing solar radiation.
Trees are a very effective means of blocking the sun’s radiation and, depending on the species and its maturity, up to 95% of the incoming radiation can be blocked. Trees can reduce a building’s temperature by directly blocking radiation through windows and cooling the surrounding air, and can also keep the soil cool thus providing a sink for heat from the building. These effects have been quantified as reducing air temperatures in built up areas by 1 to 5°C.
Reduction in Energy Demand
A typical adaptation response to the lack of external cooling is reliance on air conditioning, which generates waste heat and contributes to greenhouse gas emissions. Studies in the US have indicated that 5 to 10% of electricity demand in cities is from air conditioners used to compensate urban heat island effects. Increases in peak energy demand drive up infrastructure costs and increase the risk of power cuts during heatwaves. Air conditioner use amounts to nearly one-third of the power consumed in Perth on the hottest days in February and March.
Other Benefits
- Reduction in water run-off and erosion during storm events
- Improvement in water quality as the slowing of water run-off allows particulate matter to precipitate out and not pollute waterways
- Wind mitigation
- Improvement in air quality by absorbing gaseous pollutants and trapping particulate matter on their leaves
- Storage of carbon
- Reduction in noise pollution
- Shade for parked cars and outdoor pursuits
- Visual amenity and privacy
- Improved property values
- Attraction of birds and habitat for other wildlife
Recommended Canopy Cover
There have been many international studies of recommended canopy cover targets for urban forest. For example, according to the North Sydney report, for this climatic zone the recommended percentages for specific land-use areas are:
- 15% cover in central business districts
- 25% cover in medium and high density residential areas
- 50% cover in low density residential areas
Many cities now have urban forest targets in place, for example:
- Sydney city aims to increase urban forest cover (including private land) by 50% by 2030 and 75% by 2050
- Melbourne aims to increase canopy cover from 22 to 40% by 2040
- London aims to increase urban tree cover from the current 25% to 32% by 2065
- In 2015 New York City achieved a goal of planting one million trees to increase its urban forest by 20%
- Australian government has pledged to develop decade-by-decade goals out to 2050 for increased overall tree coverage
In 2014 the Institute for Sustainable Futures documented the tree cover in various parts of Sydney: Hornsby (59%), Ku-ring-gai (52%), Blacktown (19%), Parramatta (23%), City of Sydney (15%) and Rockdale (12%).
The figures for Hornsby and Ku-ring-gai are distorted by the inclusion of national parks that can provide some regional benefits such as improved air quality and cooling breezes if the wind is blowing in the right direction. However they do not provide the same benefits associated with trees in the immediate vicinity.
Stumbling Blocks
There are many barriers to achieving and maintaining urban forest. Generally the larger the trees the more effective are the benefits listed above. However there is a cost with managing larger trees. Trees ultimately need to be replaced when they reach their useful life expectancy. In an urban environment one cannot allow trees to reach the age where they become dangerous. There is also the need to achieve access for solar panels.
Developers will argue that the land is worth much more if it is built on. As we have seen all too often in Sydney, house blocks that had room for gardens, now have high and medium density housing with minimal, if any, tree cover remaining. SEPP65, the planning policy for high-rise is supposed to provide for deep soil planting but it does not seem to be enforced.
SEPP65, the planning policy for apartments covering all of NSW, now has a minimum deep soil requirement of only 7% of site area (Apartment Design Guide, p61). This is totally inadequate for a high rainfall area such as the North Shore where the native trees can reach heights of 30 m or more. Ku-ring-gai Council requires a minimum 50% site area for deep soil landscaping on sites over 1800 m2. This should be maintained and not over-ridden by SEPP65 Apartment Design Guide requirements.
Tiny backyards in new fringe areas and boundary-to-boundary development of new houses in existing suburbs often eliminate private land’s potential contribution to the urban forest. This puts incredible pressure on the public realm to provide the urban forest on top of needing to meet demands for infrastructure.
Compact city land-use policies and urban forest policies need to work together to ensure that cities have high-quality built environments and extensive tree cover. These policies must set the overall goals and outline strategies to deliver on them for both public and private land.
Greater Sydney Commission

The Greater Sydney Commission has been created by NSW legislation with a brief to make Sydney more liveable, more productive and more environmentally sustainable.
Currently district plans are being developed that are intended to be a link between local planning (eg council LEPs) and longer term regional planning.
Draft district plans are to be released towards the end of this year at the same time as the government is finalising the biodiversity legislation. The Greater Sydney Commission is currently undertaking extensive consultation in order to identify and prioritise issues.
This is a crucial time for the general public of Sydney to tell our politicians that our bushland and urban trees are vital. The campaign to inform the public about these issues is being led by the Total Environment Centre.
Byles Creek Decision

The tremendous efforts of the local community have produced some beneficial outcomes.
Issue 185 of STEP Matters provided an update on the battle by residents of Beecroft and the Beecroft Cheltenham Civic Trust to save bushland from subdivision and development at 79–87 Malton Road. This bushland is the last remaining corridor along Byles Creek between Lane Cove National Park and Pennant Hills Park.
The matter was brought before a Land and Environment Court conciliation conference. However it was inevitable, the final court determination approved the sub-division.
The asset protection zone around the houses to be built will entail the loss of a lot of vegetation but not as much as originally expected. There are conditions requiring the Vegetation and Fauna Management Plans applicable to the asset protection zone to take measures to preserve threatened species such as Leptospernum deanei and a possible nesting site of the Gang-gang Cockatoo. Part of the site (Lot 6 of approximately 1 hectare) will be passed into council hands to be conserved as open space.
A develpoment application for neighbouring land at 77 Malton Road (approx 7000 m2) has also been approved. Unfortunately, 77 trees will be lost for bushfire protection and construction. The owners are prepared to work with council to come to an agreement over the walking track along Byles Creek that will allow the public access to Byles Creek Valley and Lane Cove National Park.
More...
Flooding Wilderness, Wild Rivers and World Heritage
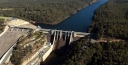
Two weeks before the Federal election with Warragamba Dam threatening to spill due to severe storms, the Baird government committed to raising the dam wall to prevent potential flood impacts on marginally held seats in western Sydney. Perhaps for the same reason, NSW Labor reversed its ‘don’t raise the dam’ position and supported the proposal. However, no new information was released to justify this decision. The economic case and environmental impact statement for such a major project are years away, so it seems to be another case of decision now, judgement later for NSW.
This is not a new proposal. A similar scheme was defeated in 1995 following a strong campaign by the Kowmung Committee led by Andrew Cox, after the Greiner–Fahey government had committed to raising the wall in 1993. The subsequent Carr government then approved construction of a large spillway beside the dam, completed in 2002, to protect it from major floods.
In December 2012 the NSW government accepted a recommendation from Infrastructure NSW in its 20 year State Infrastructure Strategy:
to review all major flood mitigation options available, including raising the Warragamba Dam wall, to significantly reduce the potential economic and social impact of flooding in the Hawkesbury Nepean Valley
This report was overseen by chief executive officer, and former Sydney Water head, Paul Broad, and ex-premier and chairperson of Infrastructure NSW, Nick Greiner. To them the dam was unfinished business.
Raising Warragamba Dam’s wall will inundate over 3,000 hectares of World Heritage listed national park lands, wilderness and wild rivers. Lower reaches of protected wild rivers, including the Kowmung, Coxs and Nattai Rivers, will be flooded. Temporary inundation caused by the proposal will scar wilderness areas, kill riverbank vegetation and deposit sediment. The affected parts of the southern Blue Mountains national parks, arguably the most protected parks in Australia, may have to be revoked, as they will be degraded if this scheme proceeds.
Temporary impoundment of floodwater will result in the ‘bath-ring effect’ – visual scarring of the landscape when natural areas are temporarily inundated. The NSW government would like us to believe that the drowned World Heritage Area will not be degraded, but once native vegetation is inundated and smothered in sediment, it becomes replaced by an eroding mess of bare earth and weeds.
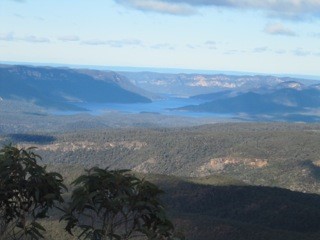 Views from McMahons Lookout, Splendour Rock, Burragorang Lookout and many others in the Blue Breaks will be ghastly. Lake Burragorang will have a much expanded ‘bath-ring’ and may also gain an enlarged Schedule One area further up the Coxs River, interfering with Katoomba to Kanangra walks, spoiling or placing off limits favoured campsites.
The Camden White Gum forests in the Kedumba Valley, listed as vulnerable under Commonwealth environment laws, will also be lost when flooded.
The Blue Mountains Conservation Society is opposed to the development. Vice-president Tara Cameron said:
We are very concerned that between Badgerys Creek airport and raising the Warragamba Dam wall, the world heritage values of the Blue Mountains will be deemed at risk by UNESCO. Australia has an international obligation to protect these areas not destroy them. This is an environmental disaster
(BM Gazette, 20 June 2016).
Developer Benefits
Former National Parks Association CEO, Andrew Cox, now with 4Nature, believes that the proposal may put more people at risk of flooding, not less. ‘We’re worried that by raising the dam and providing some level of protection it will actually trigger development on the flood plain,’ Mr Cox said.
Western Sydney Leadership Council chairman, Christopher Brown, has already flagged developing flood-prone land as a potential funding source for the dam wall extension.
‘I think there’s the capacity to use a value-capture funding method to reduce the impact on taxpayers,’ he said.
‘Maybe via a levy on land release that was previously considered flood-prone so we might be able to do it at a cheaper rate than what the government’s talking about.’ He suggested the wall extension could potentially be made higher than 14 m if such a levy was charged (Sarah Gerathy, ABC News, 17 June 2016).
Removing planning restrictions to develop flood prone areas will be highly profitable for some, but will endanger lives. In fact much of the North West Growth Centre around Riverstone is significantly affected by flood prone land. Residential areas are nevertheless planned within the maximum possible flood zone despite the acknowledgement that the enlarged dam will have no effect on extreme floods.
Flooding associated with the Upper Nepean which recently inundated Picton, as well as floods coming down the Grose, Colo and Macdonald rivers are not mitigated by the proposed dam wall raising.
Solutions
The best way to reduce the impacts of flooding on people is to relocate low-lying homes and avoid further building in flood prone areas. Floodplains are for floods and the proposed higher dam wall does not alter that fact.
Given Sydney Water’s new capacity to access water from the lower levels of Warragamba Dam, and the water security provided by the desalination plant, a less damaging solution would be to reduce the dam’s full storage level by a third and allow that proportion to be used for flood storage. The dam’s hydroelectric plant could be refurbished and then operate to lower the stored water to desired levels following a flood, while generating electricity for the national grid.
Efficient use of existing dam capacity, along with better flood planning and emergency response will save lives and the World Heritage area from an unnecessary $700 million dollar dam project and its contingent real estate development boom on the floodplain.
This article was written by Keith Muir. It was originally published in the Colong Foundation for Wilderness Bulletin, August 2016 edition. Reprinted with permission.
It’s Time to Declare Feral Deer a Pest

In the 19th century deer were imported and released into areas like Royal National Park because they were regarded as useful (for food and sport) and beautiful animals. Now their numbers have exploded.
At the request of the premier, the NSW Natural Resources Commission (NRC) has completed a pest animals management review. They released a draft report early this year and held public hearings around the state and received of over 600 submissions. Its final report and recommendations were submitted to the premier in August. The review found that pest animals cause considerable stress in communities:
It’s hard to measure, but even conservative estimates indicate NSW farmers spend around $22 million to manage pest animals per year, while the total annual economic impact of pest animals in NSW is conservatively estimated to be $170 million. Pest animals also affect 40% of all listed threatened species.
The findings cover pests that have long been causing problems for landholders such as wild dogs, pigs, foxes and rabbits, but they now also recognise that deer are a major cause for concern. For years feral deer have been allowed to run wild in NSW with management aimed at keeping deer numbers high enough to be a game resource. As the report states:
We need to manage the risks and impacts from all invasive species and that means treating feral deer and feral cats as pests just like wild pigs and dogs.
Therefore one recommendation made is that NSW government should:
- exclude all species of deer from the NSW Game and Feral Animal Control Act 2002
- include all species of feral deer in a regulation addressing pest animals under the NSW Biosecurity Act 2015
The Invasive Species Council is concerned that the powerful hunting lobby is determined to maintain the status quo. The Council is calling on people to contact the premier and the Minister for Primary Industries, Niall Blair and support the recommendations of the NRC in order to protect our natural environment from exploding feral deer numbers.
Here is a selection of facts supporting the case for the declaration of feral deer as a pest species. They:
- are out of control throughout NSW
- have been declared by the NRC to be our 'most important emerging pest animal threat'
- are a menace on our roads – in the Illawarra region feral deer have caused nine fatalities in a seven year period and 100 collisions with trains
- can be found in most regions of NSW, threatening the Royal National Park and the Illawarra escarpment rainforests, Kosciuszko National Park, the coastal forests between Newcastle and Coffs Harbour and even woodlands and rangelands in the west
- damage fences, pastures and cropsand can spread weeds and diseases
- impact rainforests and forests
- limit regeneration by reducing seed production and seedling recruitment, heavily browse ferns and other plants and push open the forest understorey
- have already been declared a feral pest in Queensland, SA and WA
Towards a Richer Understanding of Local Geology
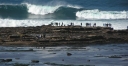
To many people who are fascinated by Sydney's native flora but have no formal training in geology, the rocks around and about are generally thought of, in simple terms, to consist either of sandstones, shales or volcanic rocks. To express this in a crude stratigraphic way there are believed to be Wianamatta shales lying above Hawkesbury Sandstone which in turn rests on Narrabeen shales. Plus there are the volcanic diatremes of course.
‘Narrabeen shales’ is a term you often hear and read especially when plant communities like Pittwater Spotted Gum Forest and coastal clay heath are described, even in the formal sense by qualified botanists, and generally refers to the Newport Formation. But this term grossly misrepresents the reality, so firstly let’s look at the Narrabeen Group in more detail.
The Narrabeen Group
This group has the widest distribution of any major suite of rocks in the Sydney Basin making up much of the Greater Blue Mountains and covering a vast swathe of the Central Coast and its hinterland. It reaches a maximum thickness of something like 800 m (by comparison, the Hawkesbury Sandstone reaches roughly 250 m in thickness). It could be argued that ‘Narrabeen’ is a poorly chosen type-locality name because, although the group is a collection of 21 distinct formations scattered across the basin, only two of them are present in full on the Northern Beaches, plus just an isolated seashore outcrop of a third one.
Local Formations of the Narrabeen Group
1. Bulgo Sandstone
The ‘isolated seashore outcrop’ is of the Bulgo Sandstone, the top 10 m of which just, but only just, breaks surface on the outer tip of Long Reef. However, out under the sea, deep drilling for the ocean sewage outfall passed through 200 m of Bulgo Sandstone.
Commonly a grey-green colour when fresh, the Bulgo Sandstone can carry, in addition to quartz, a high proportion of grains of volcanic rock of a type similar to those classic columnar-jointed lavas you see on the coast at Kiama; therefore it bears only passing resemblance to the (very quartz-rich) Hawkesbury Sandstone. You can see the Bulgo Sandstone in full at the southern end of the Royal towards Bulgo village where it forms a stunning cliff line; and its pebbly, more quartz-rich lower layers host the famous Figure 8 Pool.
The Bulgo Sandstone's volcanic sand grains break down under weathering to clays leading to the common misconception that the southern slopes of the Royal are over a shale sequence. These clay-rich soils are much deeper and more fertile than those developed over quartz sandstones, and also have inherited plant nutrients from the sandstone's volcanic component, which helps in their hosting of a diverse littoral rainforest community.
In the photo at the top of the page, facing the full brunt of the waves, the topmost 10 m of the Bulgo Sandstone emerges and protects the soft Bald Hill Claystone of the Long Reef rock platform from being washed away into the Tasman Sea.
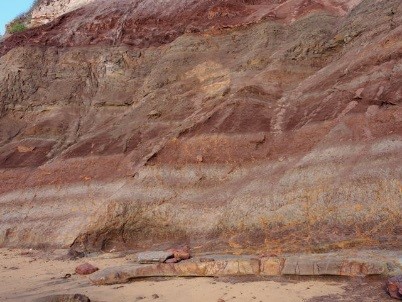 2. Bald Hill Claystone
Overlying the Bulgo Sandstone, the Bald Hill Claystone is a strange and remarkable rock by any standards. It's not a shale but the name ‘claystone’ means, like shale and mudstone, it's made largely of clay minerals. It's crumbly but only locally truly shaley.
Also, its kaolinite is stained a deep, dull red-brown (some say chocolate colour) by hematite which, like the kaolinite, was the result of recurrent contemporary weathering of layer upon layer of fine volcanic debris 248 million years ago in early Triassic times. You can see grey-green bands of sandy or gritty debris interlayered with reddish claystones in the cliff faces and platforms at Long Reef.
Bald Hill Claystone at Long Reef is also well known for its Triassic ‘paleosols’ – fossil soil profiles in which you can even recognise ancient root traces.
Red is the prominent colour of the Bald Hill Claystone but you will notice here at Long Reef that the red beds are interlayered with light coloured, greenish-grey bands made of sand grains derived from weathering of volcanic rocks.
In the Northern Beaches, the claystone only supports vegetation on Long Reef Point, though well to the south it's present below the Hawkesbury Sandstone cliffs of the Illawarra Escarpment from the Royal to at least as far as Fitzroy Falls: its formal type locality is actually Bald Hill at Stanwell Tops.
At Long Reef Point it hosts heathland, shrubland and Themeda Grassland, but with a major problem of invasive bitou bush.
3. Newport Formation
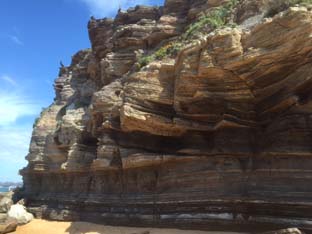
The Newport Formation rests above the Bald Hill Claystone via a transitional few metres of a curious, spotted volcanic ash deposit called the Garie Formation.
You can see a thinned version of the Newport Formation in the cliffs of North Garie Head in the Royal, then northwards it dips below the sea before surfacing low on the North Head cliffs – you can view its 15 m thick laminite and ledge-forming flaggy sandstones from the first lookout walking clockwise round the Fairfax Walk. However, it's much easier to see the formation in the cliffs from Narrabeen northwards where it consists mostly of thinly bedded sandstones and laminites with lenses of conglomerate (see photo).
Northwards along the coastline and across Pittwater into the Hawkesbury estuary there is a thickening and coarsening of the sandstones, and you can easily see this on Barrenjoey and Lion Island where only the topmost quarter of their thick sandstone cliffs belongs to the Hawkesbury Sandstone. You can often strain your eyes deciding where one formation finishes and the other begins, though the Newport sandstones tend to have dirtier, rustier weathering surfaces. The sandstones are impure quartz lithic ones and locally interbedded with laminites which are exposed especially north side of Lion Island where the formation has undergone a name change to Terrigal Formation.
The Newport Formation is host to some important plant communities. Its sandstones and laminites of the coastal cliffs weather to a stony, clay-rich soil which supports coastal clay heath and endangered Themeda Grassland. But traverse the peninsula and this all changes to pockets of littoral rainforest intermixed with endangered Pittwater Spotted Gum Forest. The host soils are weathered, thick quartz lithic sandstones with intermittent laminite layers – but definitely not shales.
Thick sandstones persist westwards and upstream into the Hawkesbury estuary but the tree species change, the principal eucalypt becoming Angophora floribunda comprising the Rough-barked Apple–Forest Oak Forest community defined by Smith & Smith in their plant survey projects for Hornsby and Warringah shire councils.
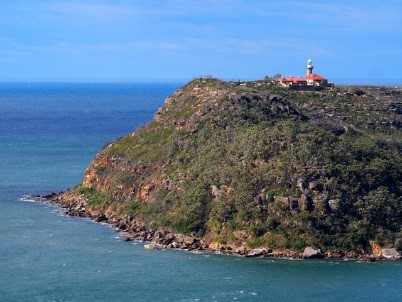
Barrenjoey lighthouse is built on a capping of Hawkesbury Sandstone but the lower two thirds of the headland is coarse-grained, rusty weathering sandstones of the Newport Formation which are the host rocks of the endangered Pittwater Spotted Gum Forest
This is the first in a series of articles by John Martyn describing his exploration of Sydney’s geology.
Heathlands: Walks and Wildflowers of the Ulladulla Headlands

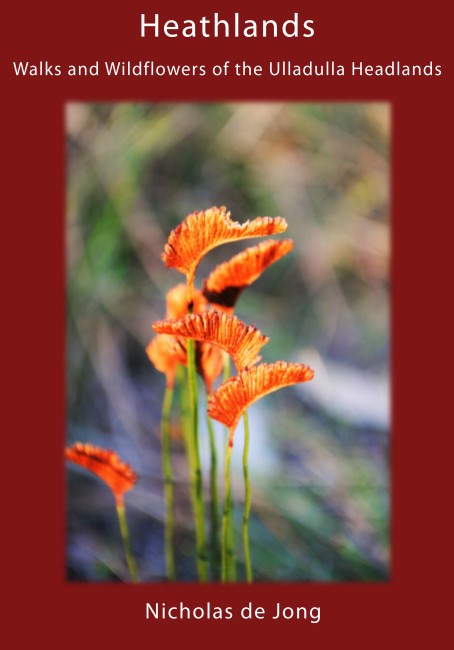 There is surprisingly little information that describes, interprets and records heathlands and its ecology in Australia. However, Nick de Jong’s book, which has more than 700 full-colour photos, goes a long way to addressing this gap in our knowledge.
Nick has recorded, identified, described and photographed more than 320 species of plants from Ulladulla’s coastal headland heathlands. The information he has collated showcases the areas species-rich native flora and it is presented in such a way that it will help you with plant identification.
Whilst the wildflowers form the heart of the book, Nick also describes ten coastal walks and discusses the evolutionary adaptations of the plants to wind, salt, fire and weed invasion. Many of these issues are the subject of current scientific study.
If you’re interested in coastal heathland plants, this book will be an important addition to your library.
- Describes 10 scenic coastal walks
- Identifies and describes 320 native plants and their flowering times
- Contains 700 full-colour photos
- Explains habitats, ecology and cultural history
- Identifies birds and butterflies
Cost: $45 ($35 + $10 postage)
To order, contactThis email address is being protected from spambots. You need JavaScript enabled to view it..